Dividend Growth Investing & Retirement is supported by its readers through donations and affiliate links. If you purchase through a link on my site, I may earn a commission. Thanks! Learn more.
As dividend growth investors, we know that wide moat stocks make a good starting point, but it is just one of many considerations on our hunt for high-quality dividend growth stocks.
Which of these companies with strong sustainable competitive advantages make good dividend growth investments?
To help answer this question,
- I’ve identified all the Canadian wide moat dividend growth stocks.
- I ranked them using a quality scoring system that includes overall safety, financial strength, credit ratings, moat analysis, and dividend safety.
- I’ve provided some additional dividend metrics like yield, valuation, dividend streaks, future dividend growth estimates, etc. so you can get a better sense of which stocks to focus on.
8 Wide Moat Dividend Growth Stocks
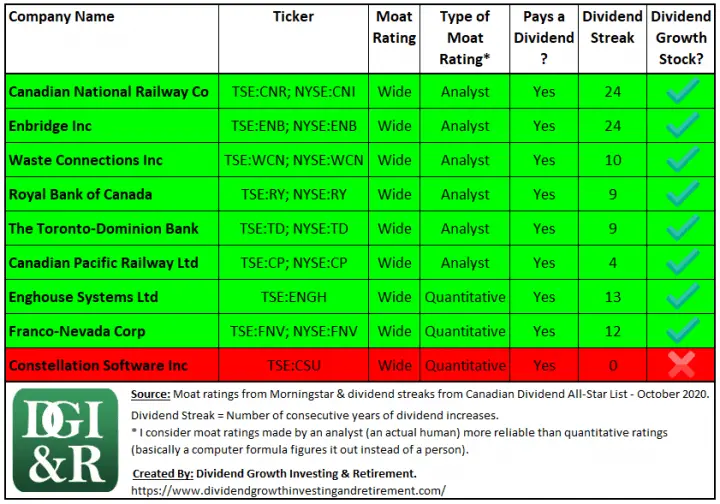
From my other article, we already know that according to Morningstar there are a total of 9 Canadian Wide Moat stocks:
Of these 9, I consider 8 of them dividend growth stocks.
Due to its lack of recent dividend growth Constellation Software Inc (TSE:CSU) is the odd one out. Constellation Software pays a $1.00 USD quarterly dividend but hasn’t increased it since early 2012.
The 8 others all have dividend streaks over 5 years, with the exception of Canadian Pacific Railway Ltd (TSE:CP; NYSE:CP) which has 4 years of consecutive dividend increases.
That said, CP Rail already announced a 15% dividend increase in July 2020 so their streak remains alive, and it’ll be updated to 5 years at the end of the year.
Ok, let’s dig into the quality rankings of each dividend growth company…
Dividend Growth Quality Rankings
I’m basing my Canadian quality rankings on David Van Knapp’s quality snapshot scoring system.
David Van Knapp’s Quality Scores
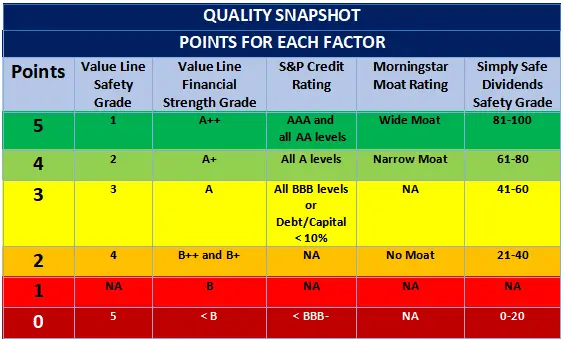
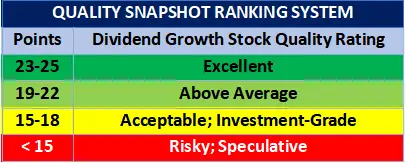
In lesson 20 of David Van Knapp’s dividend growth investing lessons series he summarizes his quality snapshot scoring system as the following:
Source: David Van Knapp’s DGI Lesson 20: My ‘Quality Snapshot’ Grading System
The scoring system is comprised of five different factors:
- Safety Ranks from Value Line,
- Financial Strength Grades from Value Line,
- S&P Credit Ratings,
- Morningstar Moat Ratings, and
- Dividend Safety Scores from Simply Safe Dividends.
For a more in-depth explanation refer to his article, or for that matter, take a look at his whole series of dividend growth investing lessons. It’s a resource so good that you will keep referring back to it.
I really like this methodical approach for analyzing the quality of US dividend stocks, BUT…
For Canadian companies, it doesn’t work as well as the various stock research companies don’t cover a lot of Canadian stocks.
For example, Value Line, typically only covers the larger Canadian stocks.
Just because Value Line or another stock research company doesn’t cover a Canadian stock, doesn’t mean it’s not a high-quality company.
As a result, I’ve tweaked David’s system to make it more suited for Canadian coverage.
Introducing the Canadian Quality Ranking System …
Canadian Quality Ranking System
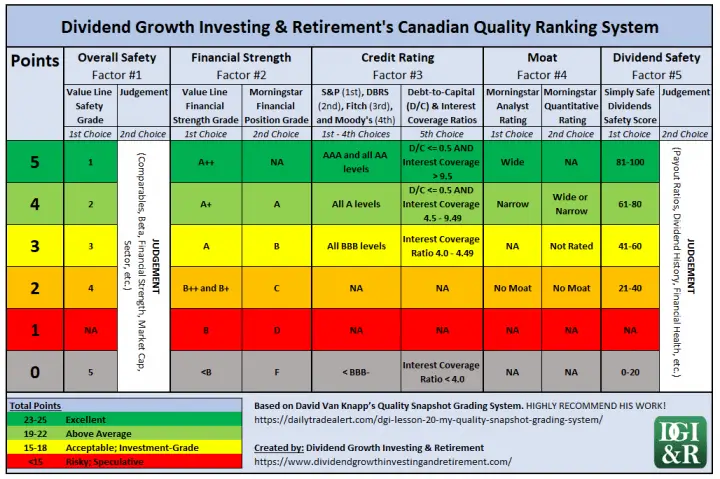
I’ve kept David’s system the same, but I’ve supplemented it with additional criteria when a stock isn’t covered by one of the research companies.
Here’s what I came up with.
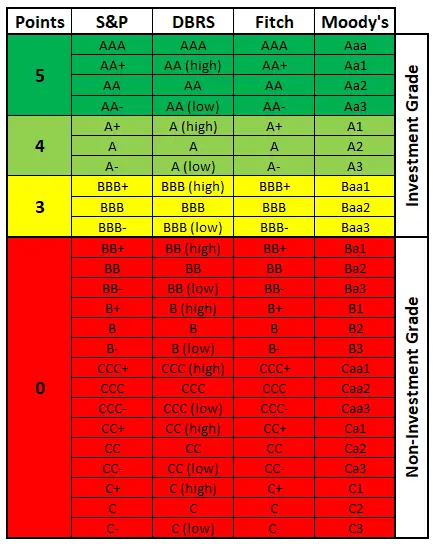
Here is a summary of how I evaluate each of the five quality factors.
Overall Safety – Factor #1
1st Choice = Value Line’s Safety Rank | 2nd = Judgement
First, I try to use Value Line’s Safety Rank, which is a combination of a stock’s weekly price stability over a five year period and its financial strength.
Safety Rank = Price Stability + Financial Strength
Here’s the link to Value Line’s more in-depth explanation of their scoring system.
High safety ranks come from highly stable prices and a strong financial strength. Low scores, the opposite.
If the Value Line rating isn’t available I have to use my own judgement.
Overall Safety Judgment Factors
To come up with a score out of 5 for overall safety I’ll look at a number of different factors.
I start with looking at safety scores of comparable companies that Value Line does cover and then looking more into the specific price stability and financial strength factors that make up the safety rank.
Price Stability Judgement Factors
- Look at comparable companies that are covered by Value Line.
- Check the 5 year beta. It’s not the same as price stability but it’s an indication of the stocks volatility. A lower beta is better in this case.
- Market capitalization (cap). Small cap stocks are typically more volatile than large cap stocks, so I’d tilt small cap stocks to have lower safety scores.
- Sectors. Certain sectors are typically more volatile than others. The basic materials sector for example is typically more volatile than the utilities sector. I might adjust the safety score down for more volatile sectors.
Financial Strength Judgement Factors
Financial strength is already being evaluated in other columns, so I use my judgment and check the Morningstar financial position grade, Credit ratings, and debt metrics.
Financial Strength – Factor #2
1st Choice = Value Line’s Financial Strength Grade | 2nd = Morningstar Financial Position Grade
If Value Line’s Financial Strength grade isn’t available I’ll use Morningstar’s Financial Position grade.
Credit Rating – Factor #3
1st Choice = S&P | 2nd = DBRS | 3rd = Fitch | 4th = Moody’s | 5th = Debt Metrics (D/C & Interest Coverage)
First I’ll check the 4 major credit rating agencies.
If I can’t find a credit rating from one of the rating agencies (Standard & Poors (S&P), DBRS, Fitch, or Moody’s), I use a combination of the Debt-to-capital ratio and Interest Coverage ratio.
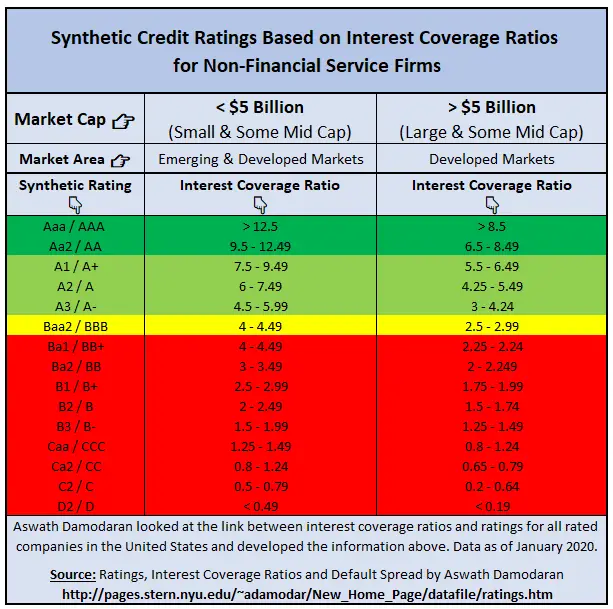
Interest Coverage Ratios & Synthetic Credit Ratings
Using the research of Aswath Damodaran on the link between interest coverage ratios and credit ratings I use the table below to find a synthetic credit rating.
Source: Ratings, Interest Coverage Ratios and Default Spread by Aswath Damodaran
The table above only works for non-financial firms, so don’t use this for banks, insurance companies, etc.
Debt-to-Capital Ratio
A debt-to-capital ratio of 50% or less is used as a pass/fail metric for the higher points (4 & 5).
If the debt-to-capital ratio is higher than 50% then the highest possible points are 3.
You can’t get a 4 or 5 if the debt-to-capital ratio is above 50%, regardless of how good the interest coverage ratio is.
Why a debt-to-capital ratio of 50% or less?
Well, this was one of the criteria mentioned in The Single Best Investment: Creating Wealth with Dividend Growth written by Lowell Miller:
“Half debt and half equity would give you a debt/capitalization of 50%. Except in specific cases weʼll be discussing later, your company should not have a ratio of more than 50%. In other words, it should not have—unless there is a compelling reason to make an exception—more debt than equity.”
Moat – Factor #4
1st Choice = Morningstar Analyst Rating | 2nd = Morningstar Quantitative Rating
If I can’t find a moat rating from a Morningstar analyst, then I’ll use their quantitative (computer figures it out instead of a human) moat rating.
I think the quantitative ratings are less reliable as they don’t get the same level of scrutiny as analyst ratings.
As a result, I’ve knocked wide moat quantitative ratings down a point in my ranking system.
A wide moat, from an analyst, gets 5 points, but a wide moat quantitative rating only gets 4.
Dividend Safety – Factor #5
1st Choice = Simply Safe Dividend Score | 2nd = Judgement
First, I try to use the Simply Safe Dividend Score, which uses a score out of 100 to rate the dividend safety of a company.
Source: Simply Safe Dividends
If the dividend safety score isn’t available from Simply Safe Dividends, I use my judgment.
Dividend Safety Judgment Factors
To come up with a score out of 5 for dividend safety I’ll look at a number of different factors like:
- Payout Ratios,
- Dividend History,
- Financial Health,
- Etc.
Quality Scores for Every Canadian Wide Moat Dividend Growth Stock
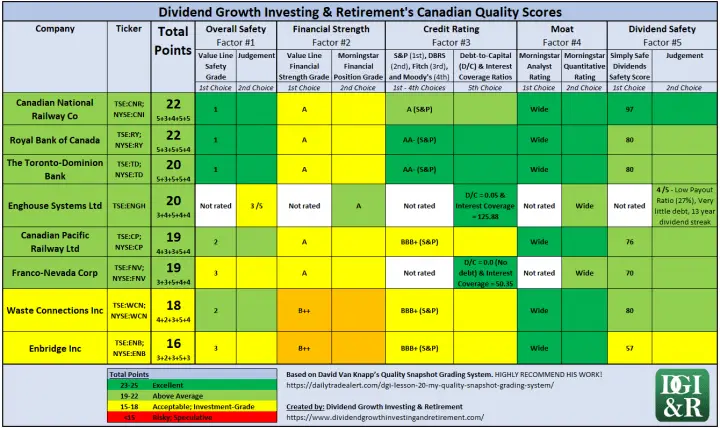
Putting all that together for the 8 Canadian wide moat dividend growth stocks, I came up with the following:
Unsurprisingly, well-known Canadian blue chips like CN Rail, Royal Bank, and TD tied for the highest score.
At the bottom, with a score of 16, is Enbridge. Considering the higher payout ratio, the difficulty all energy companies have been facing and the average credit rating, I’m not too surprised.
I know Enbridge’s high yield is enticing, but from a quality perspective, it’s a riskier investment right now.
Digging Deeper – Additional Dividend Analysis
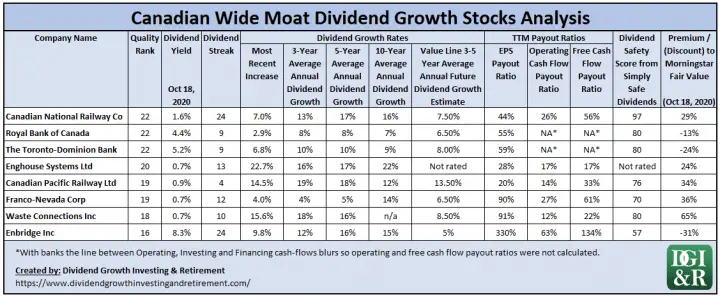
Now that we have quality scores for all 8 companies, let’s dig more into some specific dividend metrics so you can get a better sense of which stocks to focus on.
Out of the 8, the two banks, look the most interesting.
The Banks – Royal Bank of Canada (TSE:RY; NYSE:RY) & The Toronto Dominion Bank (TSE:TD; NYSE:TD)
Both have high yields over 4%, reasonable payout ratios of 60% or less, good dividend safety scores of 80, and are undervalued according to Morningstar.
Dividend growth over the past decade has been at high single digits and in TD’s case got up to 10% for the 3 and 5-year average dividend growth rates.
Value Line is expecting this dividend growth to continue. Over the next 3-5 years, they estimate annual dividend growth of 6.5% for Royal Bank and 8% for TD.
Source: Royal Bank & TD August 7, 2020 Value Line Reports
In the shorter term (1-2 years), I’d expect lower dividend growth than Value Line is guiding, due to the global pandemic.
If I had to pick one, I’d choose TD for the higher yield, slightly better dividend growth prospects and because it is a bit more undervalued.
Besides the banks, the only other undervalued stock is Enbridge.
Enbridge Inc
Enbridge’s quality score (16/25) and its dividend safety are on the low end so I consider this a riskier investment.
I understand that Enbridge’s high dividend yield, at over 8%, coupled with double-digit dividend growth over the past decade is enticing. Just understand that it comes with added risk.
The high dividend growth of the past will drop, and the dividend is only borderline safe (Enbridge’s dividend safety score is 57).
Source: Simply Safe Dividends
Considering the high EPS and free cash flow payout ratios coupled with relatively high debt I’m not surprised by the borderline dividend safety rating.
That said, a 63% payout ratio based on TTM operating cash flow means the dividend is covered by cash flow.
In fact, Enbridge’s own dividend policy is to pay out roughly 65% of what it calls Distributable Cash Flow (DCF) in dividends.
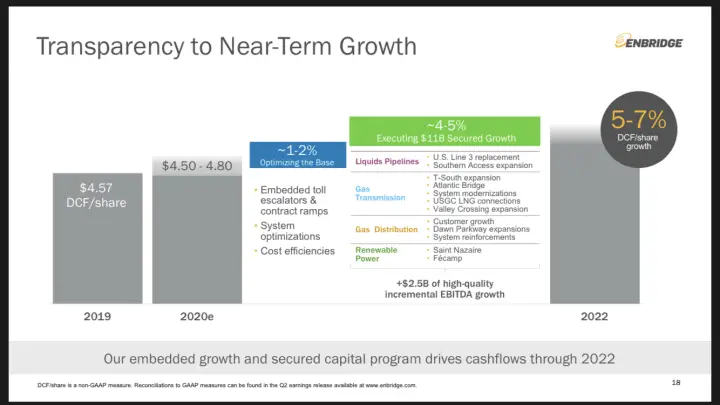
In September 2020 they reaffirmed their DCF guidance of $4.50 to $4.80 and are guiding 5-7% DCF growth to 2022.
Source: Enbridge Investment Community Presentation (September 2020)
Enbridge pays an annual dividend of $3.24 so if you trust their guidance they currently have a DCF payout ratio of 67.5% to 72%. This is already above their target of 65%.
Enbridge Dividend Growth Estimates
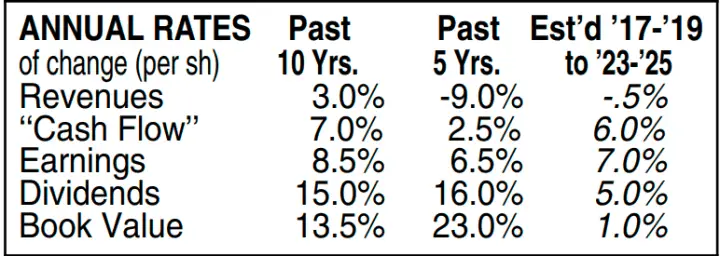
Over the next 3-5 years, Value Line estimates average annual dividend growth of 5%.
Source: Enbridge August 28, 2020 Value Line Report
Using Enbridge’s guidance, I’d estimate 0-5% dividend growth over the next few years.
Assume a 65% DCF payout ratio at the end of 2022. If Enbridge comes through:
- At the very top of their guidance ($4.80 2020 DCF + 7% growth in 2021 & 2022), you are looking at roughly 5% annual dividend growth until the end of 2022.
- At the bottom of their guidance ($4.50 2020 DCF + 5% growth in 2021 & 2022), you are looking at no (0%) dividend growth until the end of 2022.
IF (This is a big IF), everything goes according to plan in the middle of a global pandemic you are looking at +8% dividend yield from a wide moat stock with 24 years of increasing dividends with 0-5% annual dividend growth over the next two years.
Doesn’t sound so bad right?
BUT if something major goes wrong…
- say they find another growth project and take on more debt but it doesn’t go to plan, or
- something causes earnings to drop.
Then you might be looking at a dividend cut from the lower earnings/DCF.
Bottom line: Do I think Enbridge will cut the dividend?
No, but with lowish quality and dividend safety scores it’s not an investment I’d make if you plan to rely on the dividend income.
All that to say, I agree with what Simply Safe Dividends managed to say in two words, Enbridge’s dividend is “Borderline Safe”.
Canadian National Railway Co (TSE:CNR; NYSE:CNI)
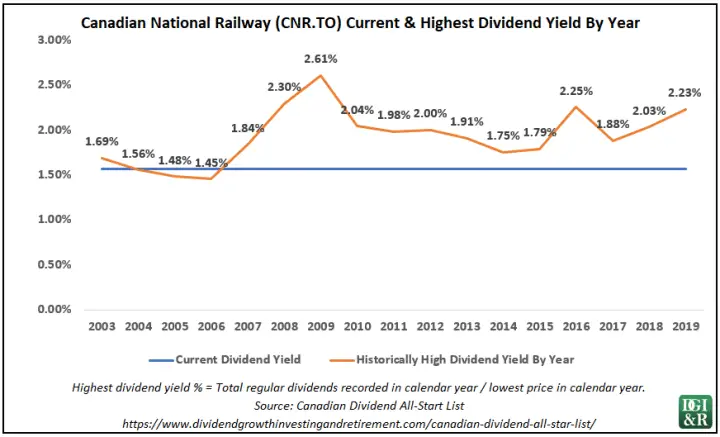
This is a high quality stock I’d love to own for its long dividend streak and high dividend growth. Unfortunately, it’s a perennial low yielder.
There’s been a few times in the past where it has gotten close to a 2.5% yield and I probably should have just bought it then.
Currently, it’s overvalued, so until the price comes down it’s not really on my radar.
Dividend growth in the near term for CN Rail looks like it won’t be as high as it has been in the past. The most recent dividend increase was 7% and Value Line’s estimate is an average of 7.5%/year over the next 3-5 years. Not quite the double-digit raises from the past decade.
Source: Canadian National Railway NYSE:CNI August 21, 2020 Value Line Report
If you are looking for higher dividend growth, it might be worth looking more into its competitor, CP Rail.
Despite CP’s less impressive dividend history, it is showing more promise for future dividend growth with Value Line estimating 13.5%/year over the next 3-5 years.
Source: Canadian Pacific Railway NSYE:CP August 21, 2020 Value Line Report
That said, CP’s yield, at less than 1%, is even lower than CN’s already low 1.6%.
The Low Yielders – Franco-Nevada Corp (TSE:FN; NYSE:FNV), Waste Connections Inc (TSE:WCN; NYSE:WCN), Canadian Pacific Railway Ltd (TSE:CP; NYSE:CP), and Enghouse Systems Ltd (TSE:ENGH)
I prefer to invest in high yield, high dividend growth stocks.
With yields of less than 1%, these 4 stocks aren’t really on my radar.
Plus, Morningstar thinks they are all currently overvalued.
For someone looking for high dividend growth, say over 10%/year, Enghouse Systems Ltd and Canadian Pacific Railway Ltd seem better positioned than Franco-Nevada Corp, and Waste Connections Inc.
Enghouse doesn’t have a dividend growth estimate from Value Line, but I’d still expect high future dividend growth from them. Historic dividend growth rates were above 15%, its most recent dividend increase was almost 23%, and it has very low payout ratios and very little debt. All good signs.
As I mentioned before, Value Line gives CP a future average annual dividend growth estimate of 13.5%. Whereas Waste Connections Inc. gets an 8.5% estimate, and Franco-Nevada Corp has 6.5%.
At the end of the day, all four of these companies have low yields and are overvalued. I’m not interested.
Summary
As dividend growth investors, we know that wide moat stocks make a good starting point, but it is just one of many considerations on our hunt for high-quality dividend growth stocks.
We want to know, which of these companies with strong sustainable competitive advantages make good dividend growth investments?
To help answer this question,
First, I identified all 8 Canadian wide moat dividend growth stocks:
- Canadian National Railway Co
- Canadian Pacific Railway Ltd
- Enbridge Inc
- Enghouse Systems Ltd
- Franco-Nevada Corp
- Royal Bank of Canada
- The Toronto-Dominion Bank
- Waste Connections Inc
Then I ranked them using a quality scoring system that includes overall safety, financial strength, credit ratings, moat analysis, and dividend safety:
And finally, to narrow the list down, I provided some additional dividend metrics like yield, valuation, dividend streaks, future dividend growth estimates, etc.
Only 3 of the 8 (Enbridge Inc, Royal Bank of Canada, and The Toronto-Dominion Bank) were undervalued.
Enbridge’s high yield (+8%) is enticing, but its lowish quality score and dividend safety score of borderline safe, make it a riskier investment.
I was more interested in the banks.
Both Royal Bank and TD have high yields over 4%, reasonable payout ratios of 60% or less, and good dividend safety scores of 80, but if I had to pick one, I’d choose TD. TD has a higher yield, slightly better dividend growth prospects and is a bit more undervalued than Royal Bank.
PS. Don’t forget to check out the rest of the wide moat articles in this series.
- What is a Moat? With 5 Canadian Wide Moat Examples
- Why Invest in Wide Moat Stocks?
- 3 Ways to Find Wide Moat Stocks
- Each & Every Wide Moat Stock in Canada
- Every Wide Moat Stock in the USA
- International Wide Moat Stocks – Every Single One Listed
- 8 Canadian Dividend Growth Wide Moat Stocks (This is the article you just read)
- 76 US Wide Moat Dividend Growth Stocks
- 23 International Wide Moat Dividend Growth Stocks
- 100 Canadian Narrow Moat Stocks
- 44 Canadian Wide & Narrow Moat Dividend Growth Stocks
Disclosure: I own shares of Enbridge and TD.
Newsletter Sign-Up & Bonus

Have you enjoyed our content?
Then subscribe to our newsletter and you'll be emailed more great content from Dividend Growth Investing & Retirement (DGI&R).
BONUS: Subscribe today and you'll be emailed the most recent version of the Canadian Dividend All-Star List (CDASL).
The CDASL is an excel spreadsheet with an abundance of useful dividend screening information on Canadian companies that have increased their dividend for five or more years in a row.
The CDASL is one of the most popular resources that DGI&R offers so don't miss out!












Great analysis!
Thanks Neil!
Really interesting. I will be interested to see your article reviewing Canadian narrow moat stocks. Was their any consideration to weighting some categories more than others? Also, I think I would consider quantifying and including in the rating some of the categories you included in your additional metrics (I’m thinking specifically of dividend yield, growth rate and value). Great job on this!
Thanks Scott!
Q: Was their any consideration to weighting some categories more than others?
A: No, the 5 quality factors are equally weighted. That said, the Value Line safety rank is 1/2 Financial Strength, 1/2 Price Stability. So by using a Value Line safety rank and a Value Line Financial Strength grade it naturally places a higher weighting on Financial Strength. Add in that credit ratings are similar to Financial Strength and that the dividend safety score also factors in debt metrics and you soon realize that the high Quality Scores I calculated for this article really tilt towards having a strong financial strength.
Q: Also, I think I would consider quantifying and including in the rating some of the categories you included in your additional metrics (I’m thinking specifically of dividend yield, growth rate and value).
A: I agree you’d want to include this in your overall analysis of a stock, but I wanted to follow David Van Knapp’s methodology for the quality scores. This is why I split this part of the analysis into two.
The idea behind the two stages, is if a company has a low quality score it’s not worth your time to dig further into the additional dividend metrics.
I hope that all made sense!
Cheers,
DGI&R
Very good analysis and methodical approach. Also you have explained very well. I thoroughly enjoyed.I read all your aticle related “moat”. Eagerly waiting to next article.
Thanks Alkesh
I appreciate a methodical approach to owning stocks. I’m still trying to establish my style and strategy to trading/investing. You have always made compelling arguments towards being a value growth investor.
Part of my problem is that I only have 12 years till I am 65 and need to grow my pot in a relatively short amount of time. So I keep dabbling in shorter term trades to try and generate more growth. This strategy has worked at times but failed me also. I attribute most of the failure part to my inexperience and think of it as the cost of my education in the markets.
That said, I do like the idea of relative safety with decent returns and thus I play a part of my portfolio in this arena to satisfy my buy and hold side of investing. Please keep doing what you are doing because people like me appreciate it and need it also. Cheers!
John
Thanks John!
Half my portfolio is in GARP (growth at reasonable price) stocks, whether they pay a dividend or not (though most do). For example CN is a low yielder but has consistent good long term Div growth, disciplined management and a wide moat. Refer to your own database on CNR. It was listed in the late 1990s at a price of just over $2.00. I’ve owned it for almost 20 years and average cost of about $9.25; currently about C$140. Its become one of my largest holdings, and though the current DY is 1.6%, the DY on my cost is about 25%. But its price appreciation is more impressive, plus its had a stock split in late 2013.
Its a similar situation with BAM.A, another one of my core holdings; small DY, but plenty of special dividends and numerous stock splits over the years.
Now that’s performance. (it makes up for many of the dogs I’ve owned over the years)