Dividend Growth Investing & Retirement is supported by its readers through donations and affiliate links. If you purchase through a link on my site, I may earn a commission. Thanks! Learn more.

As dividend growth investors, we know that wide moat stocks make a good starting point, but it is just one of many considerations on our hunt for high-quality dividend growth stocks.
Which of these international companies with strong sustainable competitive advantages make good dividend growth investments?
To help answer this question,
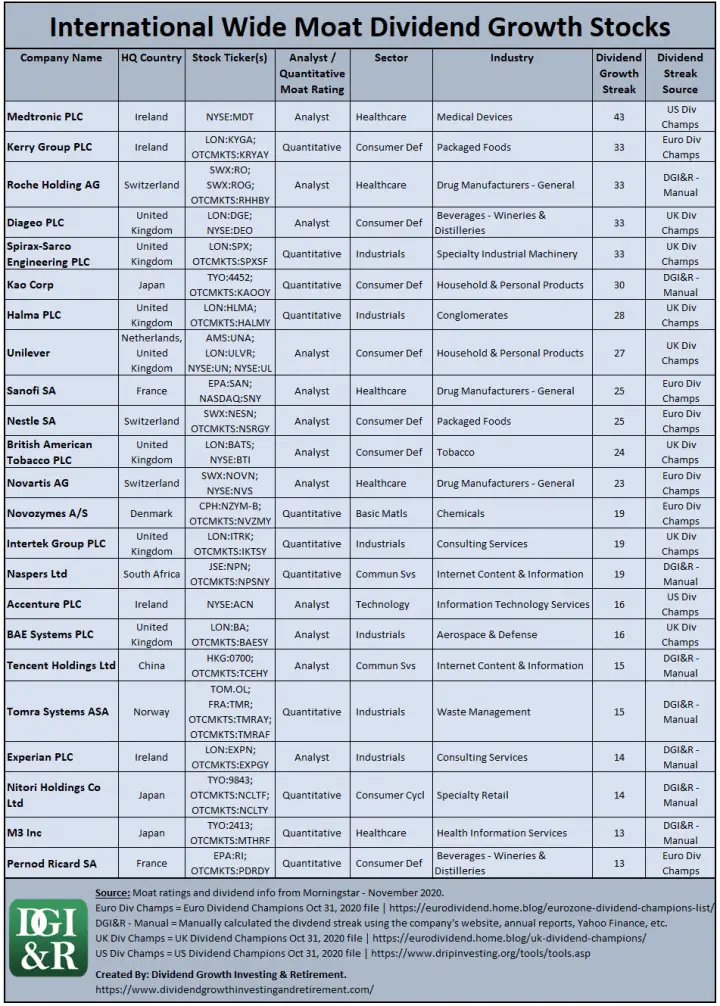
- I researched all International wide moat stocks to identify 23 companies with a 13+ year dividend growth streak.
- I ranked them using a quality scoring system that includes overall safety, financial strength, credit ratings, moat analysis, and dividend safety.
- I’ve provided some additional dividend metrics like yield, valuation, dividend streaks, future dividend growth estimates, etc. so you can get a better sense of which stocks to focus on.
I have separate articles on Canadian and US wide moat stocks, so for this article International means all countries except Canada and the USA.
You can check out the other articles in this wide moat series here:
- What is a Moat? With 5 Canadian Wide Moat Examples
- Why Invest in Wide Moat Stocks?
- 3 Ways to Find Wide Moat Stocks
- Each & Every Wide Moat Stock in Canada
- Every Wide Moat Stock in the USA
- International Wide Moat Stocks – Every Single One Listed
- 8 Canadian Dividend Growth Wide Moat Stocks
- 76 US Wide Moat Dividend Growth Stocks
- 23 International Wide Moat Dividend Growth Stocks (This is the article you are reading)
- 100 Canadian Narrow Moat Stocks
- 44 Canadian Wide & Narrow Moat Dividend Growth Stocks
Ok, let’s get to the list of every International wide moat dividend growth stock.
23 International Wide Moat Dividend Growth Stocks
I originally identified 190 International Wide Moat Stocks in my “International Wide Moat Stocks – Every Single One Listed” article. Using Morningstar to identify wide moat stocks and some extensive research I’ve narrowed it down to 23 stocks that have a dividend growth streak of 13+ years.
I wanted at least a 13-year dividend growth streak so that the company is not only increasing dividends through the COVID-19 pandemic but also in 2008 and 2009 through the global financial crisis.
Yes, dividend safety, financial health, etc. still need to be evaluated, but these 23 companies make a good starting point to create a watchlist of international dividend growth stocks.
These 23 stocks all have higher dividends in 2020 than 2019 which is a good sign as we navigate through the pandemic.
The one exception to this is Pernod Ricard SA (EPA:RI; OTCMKTS:PDRDY) which has’t announced its last 2020 dividend payment because its AGM isn’t until November 27, 2020. If Pernod Ricard announces a dividend higher than $1.94 EUR on Nov 27th then it will maintain its dividend growth streak.
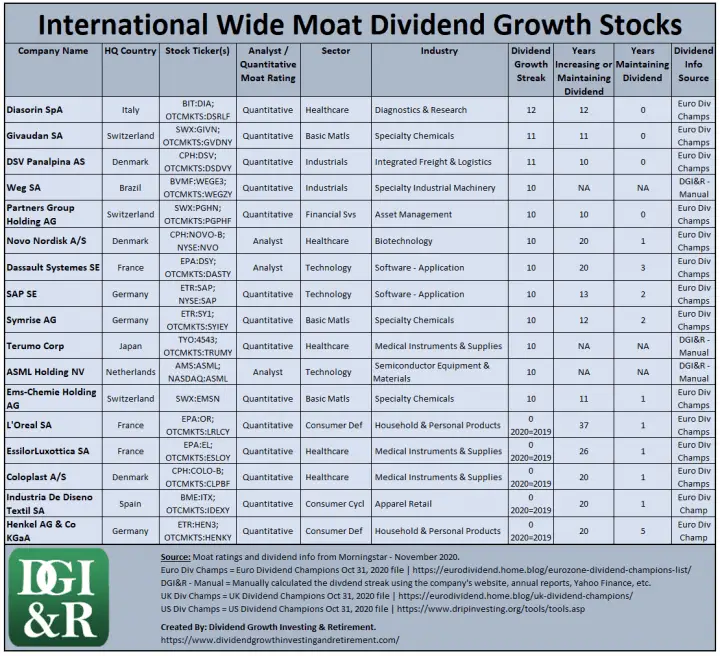
Before we go more into the quality and dividend metrics for these 23 stocks I wanted to share another 17 that you could consider adding to you watchlist.
17 More International Wide Moat Dividend Growth Stocks For Your Watch List
I prefer the more conservative 13+ year dividend growth streak as a screening method as it covers two major recessions, but I recognize that a lot of investors will use 10+ years too.
As a result, I’ve included the rest of the international wide moat dividend growth stocks with dividend growth streaks between 10 and 13 years.
I also included some stocks that had long streaks before the pandemic, but maintained the 2020 dividend (2020 dividends = 2019 dividends).

L’Oréal (EPA:OR; OTCMKTS: LRLCY) is a good example.
In the past 37 years, they increased dividends for 36 of them and maintained it for 1 year.
Did L’Oréal increase dividends in 2020?
No, but…
Do I think they’ll get back to increasing the dividend with 37 years of increasing or maintaining the dividend?
Yes.
So, I’ve added five stocks in the table below (very bottom of the list). All five have a 20+ year history of either maintaining or increasing the dividend but kept 2020 dividends the same as 2019 levels.
Here’s the table:
The focus of this article going on is going to be the 23 stocks from the first table with 13+ year dividend growth streaks, but …
I think that these two lists/tables above give you a good number of stocks to pick and choose from. This way you can add the ones you are interested in to your personal watchlist.
Ok, let’s dig into how I’ll be ranking the 23 International companies with quality scores…
Dividend Growth Quality Rankings
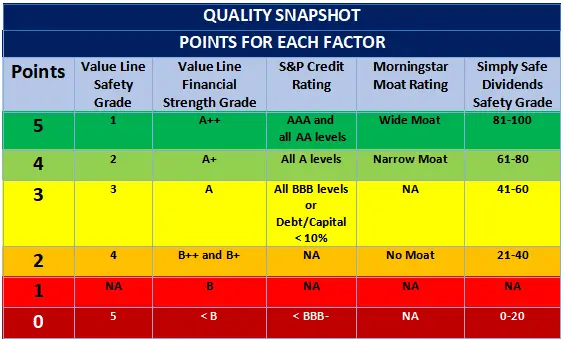
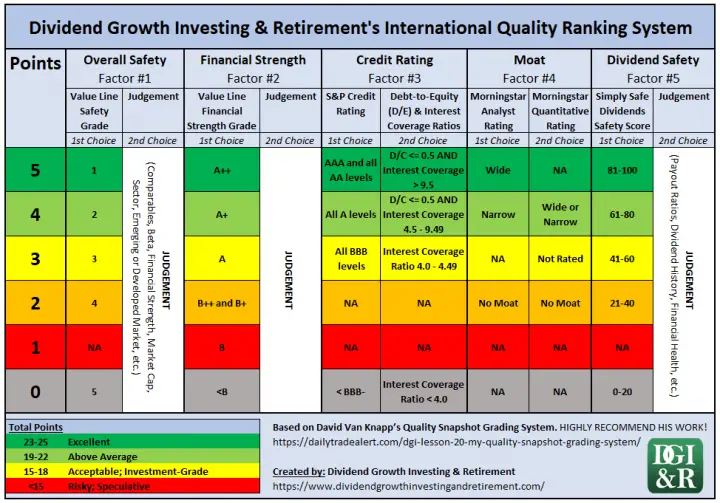
I’m basing my quality rankings on David Van Knapp’s quality snapshot scoring system.
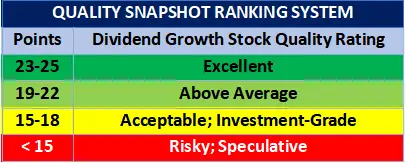
In lesson 20 of David Van Knapp’s dividend growth investing lessons series he summarizes his quality snapshot scoring system as the following:
Source: David Van Knapp’s DGI Lesson 20: My ‘Quality Snapshot’ Grading System
The scoring system is comprised of five different factors:
- Safety Ranks from Value Line,
- Financial Strength Grades from Value Line,
- S&P Credit Ratings,
- Morningstar Moat Ratings, and
- Dividend Safety Scores from Simply Safe Dividends.
For a more in-depth explanation refer to his article, or for that matter, take a look at his whole series of dividend growth investing lessons. It’s a resource so good that you will keep referring back to it.
I really like this methodical approach for analyzing the quality of US dividend stocks, BUT…
For international companies, it doesn’t work as well as the various research companies don’t cover a lot of these stocks.
For example, Value Line only covers 8 of the 23 International wide moat dividend growth stocks I’ll be looking into.
Just because Value Line or another stock research company doesn’t cover an International stock, doesn’t mean it’s not a high-quality company.
As a result, I’ve tweaked David’s system to make it more suited for International coverage.
Introducing the International Quality Ranking System …
International Quality Ranking System
I’ve kept David’s system the same, but I’ve supplemented it with additional criteria when a stock isn’t covered by one of the research companies.
Here’s what I came up with.
Here is a summary of how I evaluate each of the five quality factors.
Overall Safety – Factor #1
1st Choice = Value Line’s Safety Rank | 2nd = Judgement
First, I try to use Value Line’s Safety Rank, which is a combination of a stock’s weekly price stability over a five year period and its financial strength.
Safety Rank = Price Stability + Financial Strength
Here’s the link to Value Line’s more in-depth explanation of their scoring system.
High safety ranks come from highly stable prices and a strong financial strength. Low scores, the opposite.
If the Value Line rating isn’t available I have to use my own judgement.
Overall Safety Judgment Factors
To come up with a score out of 5 for overall safety I’ll look at a number of different factors.
The stocks I’m covering in this article cover both developed and emerging markets. If the country is in an emerging market I’ll typically drop the safety score a point or two to address the increased risk of investing in these countries.
Then I start to look at safety scores of comparable companies that Value Line does cover and then look more into the specific price stability and financial strength factors that make up the safety rank.
This doesn’t work all that well because they don’t cover a lot of international stocks, but I do the best I can.
Price Stability Judgement Factors
- Look at comparable companies that are covered by Value Line.
- Check the 5 year beta. It’s not the same as price stability but it’s an indication of the stocks volatility. A lower beta is better in this case.
- Market capitalization (cap). Small cap stocks are typically more volatile than large cap stocks, so I’d tilt small cap stocks to have lower safety scores.
- Sectors. Certain sectors are typically more volatile than others. The basic materials sector for example is typically more volatile than the utilities sector. I might adjust the safety score down for more volatile sectors.
Financial Strength Judgement Factors
Financial strength is already being evaluated in other columns, so I use my judgment and look at the other columns. I’ll also consider things like credit ratings and debt metrics, etc.
Financial Strength – Factor #2
1st Choice = Value Line’s Financial Strength Grade | 2nd = Judgement
If Value Line’s Financial Strength grade isn’t available I use judgement to look at the debt-to-equity ratio, interest coverage ratio, credit ratings, etc.
I’m trying to mimic Value Line with my judgement here, but I’ll be honest here and tell you that I don’t have a high degree of confidence that my judgment is going to be that close to Value Lines assessment.
Credit Rating – Factor #3
1st Choice = S&P | 2nd = Debt Metrics (D/E & Interest Coverage)
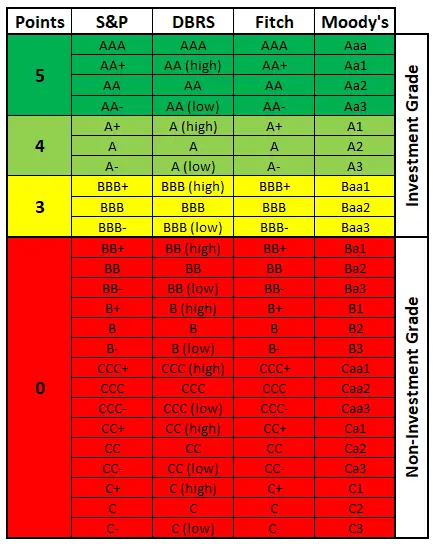
First I’d normally check the 4 major credit rating agencies.
If I can’t find a credit rating from one of the rating agencies (Standard & Poors (S&P), DBRS, Fitch, or Moody’s), I use a combination of the Debt-to-Equity ratio and Interest Coverage ratio.
When it came to the 23 international stocks I’m focusing on, S&P was enough. If S&P didn’t cover them, then the other three rating agencies also didn’t cover them.
As a result, I’ve just included the S&P credit where available.
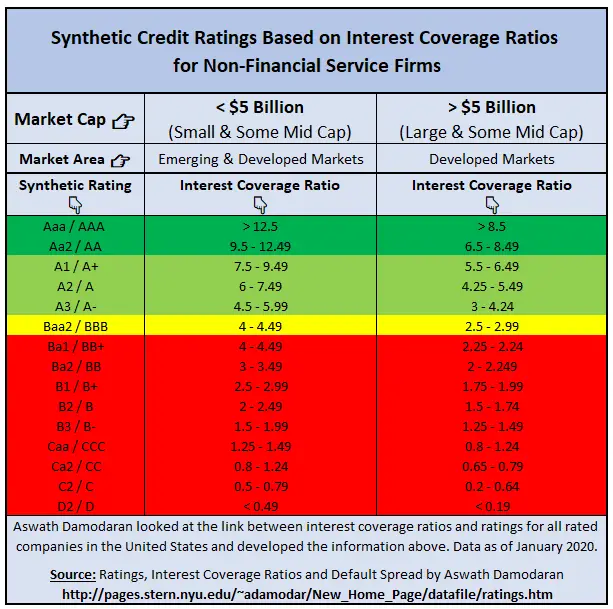
Interest Coverage Ratios & Synthetic Credit Ratings
Using the research of Aswath Damodaran on the link between interest coverage ratios and credit ratings I use the table below to find a synthetic credit rating.
Source: Ratings, Interest Coverage Ratios and Default Spread by Aswath Damodaran
The table above only works for non-financial firms, so don’t use this for banks, insurance companies, etc.
Debt-to-Equity Ratio
A debt-to-equity ratio of less than 1.0 or 100% is used as a pass/fail metric for the higher points (4 & 5).
If the debt-to-equity ratio is higher than 100% then the highest possible points are 3.
You can’t get a 4 or 5 if the debt-to-equity ratio is above 100%, regardless of how good the interest coverage ratio is.
Why a debt-to-equity ratio of 100% or less?
Well, this was one of the criteria mentioned in The Single Best Investment: Creating Wealth with Dividend Growth written by Lowell Miller:
“Half debt and half equity would give you a debt/capitalization of 50%. Except in specific cases weʼll be discussing later, your company should not have a ratio of more than 50%. In other words, it should not have—unless there is a compelling reason to make an exception—more debt than equity.”
Yes, “Half debt and half equity would give you a debt/capitalization of 50%”, but it also gives you a debt/equity ratio of 100%.
The quote mentions a debt-to-capital ratio, but it’s easier for me to pull the debt-to-equity ratio, so I’ve used D/E instead as the same concept applies.
In this article I used the D/E ratio from Morningstar.
Moat – Factor #4
1st Choice = Morningstar Analyst Rating | 2nd = Morningstar Quantitative Rating
If I can’t find a moat rating from a Morningstar analyst, then I’ll use their quantitative (computer figures it out instead of a human) moat rating.
I think the quantitative ratings are less reliable as they don’t get the same level of scrutiny as analyst ratings.
I’ve also noticed that quantitative moat ratings do seem to change quite a bit. Even comparing some stocks from a month ago to today I noticed that some quantitative wide moat ratings from a month ago were downgraded to narrow moats and other narrow moats were upgraded.
This seems to happen a fair amount with the quantitative ratings, so I’ve knocked wide moat quantitative ratings down a point in my ranking system.
A wide moat, from an analyst, gets 5 points, but a wide moat quantitative rating only gets 4.
Dividend Safety – Factor #5
1st Choice = Simply Safe Dividend Score | 2nd = Judgement
First, I try to use the Simply Safe Dividend Score, which uses a score out of 100 to rate the dividend safety of a company.
Source: Simply Safe Dividends
If the dividend safety score isn’t available from Simply Safe Dividends, I use my judgment.
Dividend Safety Judgment Factors
To come up with a score out of 5 for dividend safety I’ll look at a number of different factors like:
- Payout Ratios,
- Dividend History,
- Financial Health,
- Etc.
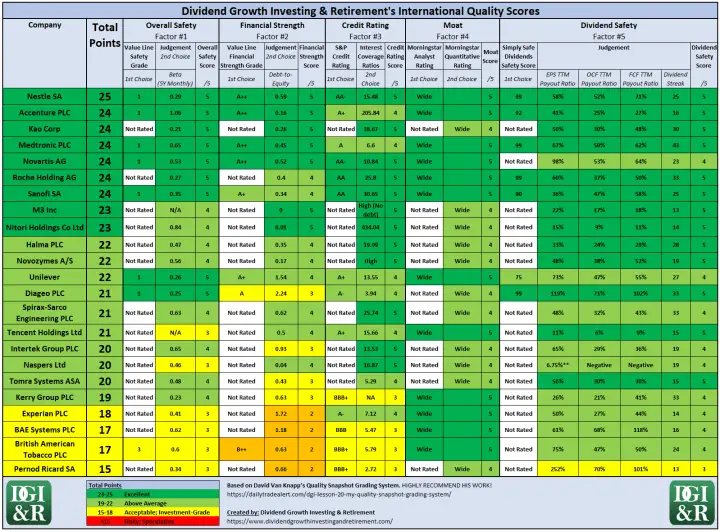
Quality Scores for 23 International Wide Moat Dividend Growth Stocks
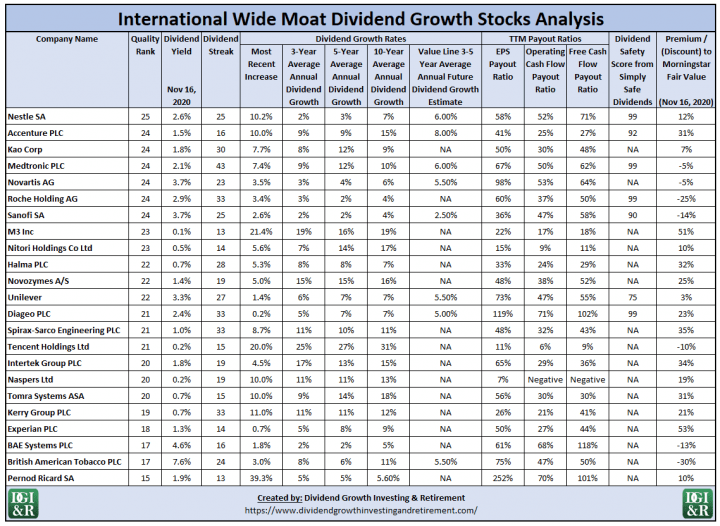
Putting all that together for the 23 International wide moat dividend growth stocks, I came up with the following:
At the top, with the only perfect score was a company you’ll likely recognize: Nestle (SWX:NESN; OTCMKTS:NSRGY).
There were a few Japanese names that I hadn’t really heard of before so I’ll be looking more into Kao Corp (TYO:4452; OTCMKTS:KAOOY), Nitori Holdings Co Ltd (TYO:9843; OTCMKTS:NCLTF; OTCMKTS:NCLTY), and M3, Inc. (TYO:2413; OTCMKTS:MTHRF).
You might be wondering, Why did Medtronic make it into an International list, and not a US list?
I don’t really consider Medtronic (NYSE:MDT) an international stock even though it’s headquartered in Ireland. I consider them more a US stock. As I was using the headquarter country to determine if it was international or not, it’s still showing as International. They used to be based in the US and still pay out USD dividends, but moved their HQ to Ireland a while ago.
Now for a word of caution when looking at these quality scores.
Don’t Trust My Judgement
International stocks aren’t covered as well as North American stocks by the research companies I’m using so I had to rely a lot more on my judgment to come up with quality scores.
As a result, I don’t trust these quality scores as much as the ones I did in my Canadian and US wide moat dividend growth articles from a few weeks back.
Instead of focusing too much on the specific quality score out of 25, I think it’s better to focus on the overall category/rating I’ve classified the stock in.
Source: David Van Knapp’s DGI Lesson 20: My ‘Quality Snapshot’ Grading System
Looking at the quality score of Roche Holding AG (SWX:RO; SWX:ROG; OTCMKTS:RHHBY) which has a 24/25 score and immediately thinking that’s better than M3, Inc.’s 23/25 score isn’t necessarily what I want you to do.
Instead, realize that both are in the “Excellent” quality category and then continue evaluating them based on your own investment criteria.
Digging Deeper – Picking Among The Best & Additional Dividend Analysis
Now that we have quality ratings for all 23 companies, let’s dig more into some specific dividend metrics so you can get a better sense of which stocks to focus on.
Excellent Quality International Wide Moat Dividend Growth Stocks (Quality Scores of 23-25)
Nothing is really jumping out at me when I look at the excellent quality stocks. Mostly I see a list of stocks that I’d want to wait for better valuations on or higher starting yields.
Novartis AG, Roche Holding AG, and Sanofi SA
If you want a higher yield and undervalued stock then Novartis AG (SWX:NOVN; NYSE:NVS), Roche Holding AG, and Sanofi SA (EPA:SAN; NASDAQ:SNY) are probably where you’d start looking.
That said, none of them are showing particularly great dividend growth rates.
Value Line is estimating 5.5% average dividend growth per year over the next 3-5 years for Novartis AG, but with the lowish recent dividend growth and yield under 4%, I’m still not particularly inspired.
3 Japanese Dividend Growth Stocks – Kao Corp, M3, Inc. and Nitori Holdings Co Ltd
I wasn’t really aware of the Japanese dividend growth market until I wrote this article so it was nice to discover some new ideas.
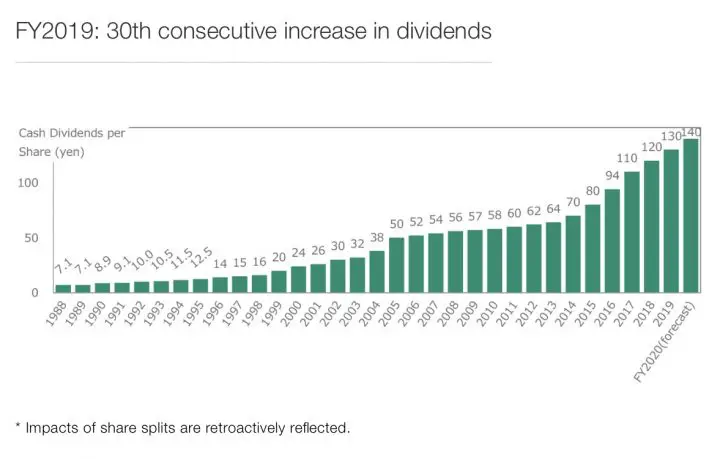
With a 30 year dividend streak, Kao Corp interests me the most of the three, but not at its current valuation.
Source: Kao Corp Shareholder Return Policy
I’ll be adding this one to my watchlist for a better entry point.
The other two, M3, Inc. and Nitori Holdings Co Ltd, are just too low yield for me.
Above Average Quality International Wide Moat Dividend Growth Stocks (Quality Scores of 19-22)
Of the 10 “Above Average” quality stocks:
- Only one is currently undervalued, Tencent Holdings Ltd.
- Unilever is the only one trading around fair value.
- The other 8 appear over-valued.
Tencent Holdings Ltd
Tencent Holdings Ltd (HKG:0700; OTCMKTS:TCEHY) is showing strong dividend growth rates, but with a yield of 0.2% it’s just too low for me.
Unilever & Diageo PLC
Unilever (AMS:UNA; LON:ULVR; NYSE:UN; NYSE:UL) and Diageo PLC (LON:DGE; NYSE:DEO) have the highest yields of the 10 above average quality stocks, but their most recent dividend increases were paltry.
That said, Value Line is estimating 5.5% average dividend growth per year over the next 3-5 years for Unilever and 5% for Diageo.
Of the two, I prefer Unilever for the better valuation and higher yield.
I don’t plan on investing in either right now, but they will remain on my watchlist.
Acceptable/Investment Grade Quality International Wide Moat Dividend Growth Stocks (Quality Scores of 15-18)
I’d generally avoid these ones and focus on the higher quality names above.
If you do look at these, focus on the higher scores of 18 or closer to it.
If you are looking for yield, BAE Systems PLC (LON:BA; OTCMKTS:BAESY) and British American Tobacco PLC (LON:BATS; NYSE:BTI) stand out. Both are undervalued too.
BAE Systems PLC
I don’t like that BAE has a BBB credit rating, I want at least BBB+.
Also recent and past dividend growth has been quite low. Basically at 2%/year for the past five years.
That doesn’t send a strong signal that even before the pandemic BAE was only increasing around two percent a year.
British American Tobacco PLC
So of the high yield undervalued options, that leaves, British American Tobacco PLC.
Even though the quality score of 17 is the same as BAE’s, I prefer British American Tobacco.
I think the dividend growth of British Tobacco will be stronger than BAE’s, it has a higher yield and it’s also more undervalued.
It has a TTM FCF payout ratio of 50% and Value Line is estimating 5.5% average dividend growth per year over the next 3-5 years. As a high yield, reasonable dividend growth option I understand why some might be intrigued.
I don’t invest in Tobacco stocks, so it’s not something I’ll be investing in, but it stood out among the acceptable quality ranked stocks.
Pernod Ricard SA
At the bottom of the list is alcohol producer Pernod Ricard SA (EPA:RI; OTCMKTS:PDRDY). If you drink, you’ve probably had something of theirs at one point or another.
I might have been a bit hard on Pernod Richard with my quality score of 15, but I’m worried they won’t increase the dividend at the end of November and instead keep it at 2019 levels.
If they do increase I’d only expect a small increase. This is despite the most recent dividend increase of 39.3% shown in the table above. This was from before the pandemic, so don’t take it as a strong dividend signal.
I’d wait until the November 27th AGM and see what comes of that before making any final decisions.
Bonus: How To Find Dividend Growth Streaks For International Companies
There were four ways I researched dividend growth streaks.
By far the most useful are the three dividend lists below.
The fourth involves looking at a combination of the company website, financial reports, and the dividend section of “Historical Data” on Yahoo Finance.
Two tips if you are using Yahoo Finance.
- Use the home country stock ticker to get the dividends in the home currency. For example I’d use London stock exchange ticker “DGE.L” instead of the NYSE ADR ticker of DEO to get the dividend payments for Diageo PLC shown in GBP instead of USD.
- Check and adjust for stock splits.
Here are the three dividend lists:
1. UK Dividend Champions List
The UK Dividend Champions List is a free excel spreadsheet with stock information on UK companies that have either increased OR maintained their dividend for 5+ years in a row.
Christophe Soulet updates the list every month.
2. Eurozone Dividend Champions List
Similar to the UK list, the Eurozone Dividend Champions List is a free excel spreadsheet with stock information on Eurozone (19 countries), Swiss, Danish and Swedish companies that have either increased OR maintained their dividend for 5+ years in a row.
Christophe Soulet updates the list every month.
3. US Dividend Champions List
This one might surprise you, but some International dual listed stocks are listed on a US stock exchange as an ADR (American depositary receipt).
Or a company might originally be headquartered in the US, but then changes its HQ to another country. You see this with some companies that are now headquartered in Ireland, but are still paying USD dividends and are still included in the US Dividend Champions List. A good example of this is Medtronic PLC (NYSE:MDT).
The US Dividend Champions List is a free excel spreadsheet with stock information on US companies that have either increased or maintained their dividend for 5+ years in a row.
Champions have 25+ year dividend streaks, Contenders have 10-24 year dividend streaks, and Challengers have 5-9 year dividend streaks.
The spreadsheet was created in 2008 by Dave Fish (deceased 2018), and is now updated monthly by Justin Law.
Summary
As a Canadian dividend growth investor, I use US and International stocks to fill gaps in my portfolio from underrepresented Canadian sectors. Sectors like Healthcare, Consumer Staples, Technology, etc.
International wide moat stocks make a good starting point, but it is just one of many considerations when searching for high-quality dividend growth stocks.
We want to know, which of these international companies with strong sustainable competitive advantages make good dividend growth investments?
To answer to this…
I first identified 23 international wide moat dividend growth stocks that have a history of increasing dividends through the past two major recessions:
- Accenture PLC
- BAE Systems PLC
- British American Tobacco PLC
- Diageo PLC
- Experian PLC
- Halma PLC
- Intertek Group PLC
- Kao Corp
- Kerry Group PLC
- M3 Inc
- Medtronic PLC
- Naspers Ltd
- Nestle SA
- Nitori Holdings Co Ltd
- Novartis AG
- Novozymes A/S
- Pernod Ricard SA
- Roche Holding AG
- Sanofi SA
- Spirax-Sarco Engineering PLC
- Tencent Holdings Ltd
- Tomra Systems ASA
- Unilever
Second, I ranked them using a quality scoring system that includes overall safety, financial strength, credit ratings, moat analysis, and dividend safety:
And finally, to narrow the list down, I provided some additional dividend metrics like yield, valuation, dividend streaks, future dividend growth estimates, etc.
None of these stocks really jumped out at me as a great deal, but it does make for a good list of quality international dividend growth stocks to add to your watchlist.
If you want to start off with a reasonable yield, I’d be keeping an eye on the following international wide moat dividend growth stocks and hope for better valuations in the future:
- Diageo PLC
- Kao Corp
- Medtronic PLC
- Nestle SA
- Novartis AG
- Roche Holding AG
- Sanofi SA
- Unilever
PS. Don’t forget to check out the rest of the wide moat articles in this series.
- What is a Moat? With 5 Canadian Wide Moat Examples
- Why Invest in Wide Moat Stocks?
- 3 Ways to Find Wide Moat Stocks
- Each & Every Wide Moat Stock in Canada
- Every Wide Moat Stock in the USA
- International Wide Moat Stocks – Every Single One Listed
- 8 Canadian Dividend Growth Wide Moat Stocks
- 76 US Wide Moat Dividend Growth Stocks
- 23 International Wide Moat Dividend Growth Stocks (This is the article you just read)
- 100 Canadian Narrow Moat Stocks
- 44 Canadian Wide & Narrow Moat Dividend Growth Stocks
Disclosure: I own shares of Novo Nordisk. You can see my portfolio here.
Newsletter Sign-Up & Bonus

Have you enjoyed our content?
Then subscribe to our newsletter and you'll be emailed more great content from Dividend Growth Investing & Retirement (DGI&R).
BONUS: Subscribe today and you'll be emailed the most recent version of the Canadian Dividend All-Star List (CDASL).
The CDASL is an excel spreadsheet with an abundance of useful dividend screening information on Canadian companies that have increased their dividend for five or more years in a row.
The CDASL is one of the most popular resources that DGI&R offers so don't miss out!











DGI&R,
Excellent work done here but I see several errors in the Quality Scores table, notably in the payout ratio and dividend streak columns which lead to incorrect Dividend Safety scores and overall Total Points. I don’t know which it is but either the recorded numbers are incorrect or the colour assessments are off.
Hi Bernie,
Which companies did you notice this for? I’ll want to fix any mistakes!
How I did the table coloring: If the Dividend Safety Score /5 Column was 5 everything in that category including payout ratios was the greenest.
If it was 4, everything was the lighter green including the payout ratios.
Also if the Simply safe dividend score was available this overrides any payout ratio info. Diageo is a good example where this looks a little odd. Diageo has a Simply safe dividend score of 99, but its EPS and FCF payout ratios are over 100%. All the columns are the brighter green because they score 5/5 for dividend safety.
As I write this out, I can see why this would be confusing. Maybe I should change all the payout ratios to white backgrounds and just color the Dividend Safety Score /5 Column.
If you have any suggestions, please share too.
Payout Ratios were calculated using TTM data from morningstar for the home country stock, not the ADR.
Cheers,
DGI&R
DGI&R,
OK I understand now how you gave the same colouring for everything in the category. What I don’t understand is how the Simply Safe Dividends Safety Scores and the Dividend Safety Scores /5 were determined. They don’t appear to factor in payout ratios in their calculations. Blatant examples would be Diageo and Unilever. I don’t see how Diageo was given a 99 & 5/5 rating and Unilever only a 75 & 4/5 score. If the payout ratios were included in their calculations Unilever should have had a much lower SSD score and dark greens across the category and Diageo would have had a much lower SSD and /5 rating. I also don’t understand how they could give a /5 score to companies not rated in all categories.
On another matter, why can’t I open links which have “wordpress.com” in their address in my emails?
The Simply Safe Dividend Scores out of 100 use more than just payout ratios. I copied this from their website:
“Our Dividend Safety Score system takes into account more than a dozen fundamental metrics that influence a company’s ability to continue paying dividends. Some of the metrics scrubbed are a company’s:
Payout ratios
Debt levels and coverage metrics
Recession performance
Dividend longevity
Industry cyclicality
Free cash flow generation
Recent sales and earnings growth
Return on invested capital”
If the simply safe score was 81-100 then I gave it 5/5 overall, 61-80 got 4/5 overall, etc.
I do agree that Diageo and unilever look odd when you compare them, but you also have to remember that I’m using TTM numbers that cover the pandemic so this could skew things. That and simply safe takes a lot more into consideration than just the payout ratios.
DGI&R,
Thanks. I did look at the other metrics shown. UL outperformed DEO on almost all counts. Perhaps, as you say, your TTM numbers likely skewed the scores.
I’m not sure about the Wordpress link issues. I didn’t think I was sending emails out with Wordpress links. Which specific link are you referring to?
DGI&R,
I can’t give you specifics on the emails as I’ve already deleted them. All I can say until it happens again is that the links wouldn’t open. I get the same issues with another blog I follow, or did follow because I can’t open any of their links. I tried to unsubscribe the other blog but can’t open that link either. The links in question go through WordPress. When it happens again I’ll let you know.