Dividend Growth Investing & Retirement is supported by its readers through donations and affiliate links. If you purchase through a link on my site, I may earn a commission. Thanks! Learn more.
“The concept of identifying undervalued and overvalued stock prices according to historic patterns of dividend yield can be applied to any stock with a reasonably long dividend history. However, investors who make the decision to include only high-quality, blue-chip stocks in their considerations will probably never regret it.”
Source: Dividends Don’t Lie – Geraldine Weiss/Janet Lowe
Why should you use dividend yield as a valuation tool for stocks?
The answer is quite simple.
It works.
Wow, that was my shortest article ever!
Joking aside, that really is the main point of this article.
Dividend Yield as a Valuation Tool Works
Yes, like all valuation methods, there are some flaws to be aware of, and we’ll get to those later.
⭐ Find dividend growth stocks that have survived multiple recessions and increased dividends for 5, 10, 25+ years in a row.
But, at the end of the day, dividend yield as a valuation tool seems to work.
Not only does it work, but it’s been working for a very long time.
“Dividend yield is actually one of the oldest valuation methods. It was very popular back in the days when dividends were the primary reason people owned stocks, and it is still widely used today, mainly among income-oriented investors.”
Source: MorningStar Course 402: Using Ratios and Multiples – Dividend Yield
Something that’s been around for over a century wouldn’t still be used if it didn’t work.
A more recent example, but still decades old, comes from Geraldine Weiss’s 1988 book, Dividends Don’t Lie:
“Three fundamental measures of value are:
- Dividend yield,
- price/earnings ratio and
- price/book-value ratio.
Again, dividend yield – calculated by dividing the dividend by the price – is the most telling yardstick.”
I like using Dividends Don’t Lie as an example because it details how the author’s US newsletter, Investment Quality Trends, uses the dividend yield history of blue chip dividend stocks to determine when the stock is under or over-valued.
Because the Investment Quality Trends (IQT) newsletter still exists today, it serves as a real-life example of how the dividend yield theory has stood up to the test of time.
“According to the dividend-yield theory, the price of a stock is driven by its yield. When a stock offers a high dividend yield, investors will buy, which pushes the price up and gradually erodes the yield. When the yield falls, the stock is shunned, until an absence of demand allows its price to fall. It then descends to a price level at which, again, the yield is attractive to investors.”
Source: Dividends Don’t Lie – Geraldine Weiss/Janet Lowe
The idea behind IQT is to buy blue chip stocks when the yield is historically high (under-valued) and sell when the yield becomes historically low (over-valued).
“Years of stock market research have shown that stocks generally fluctuate between repetitive extremes of high dividend yield and low dividend yield. These recurring extremes of yield can be used to establish a channel of undervalued and overvalued price levels.”
Source: Dividends Don’t Lie – Geraldine Weiss/Janet Lowe
IQT uses dividend yield to chart overvalue and undervalue lines on top of the stock price. The overvalue line they use as a signal to sell, and the undervalue line a signal to buy. Example below:

Source: https://iqtrends.com/subscriptions_about_the_charts.php
Now, I tend to lean towards a more buy and hold approach, but it’s hard to argue with the long term results of the Investment Quality Trends newsletter.
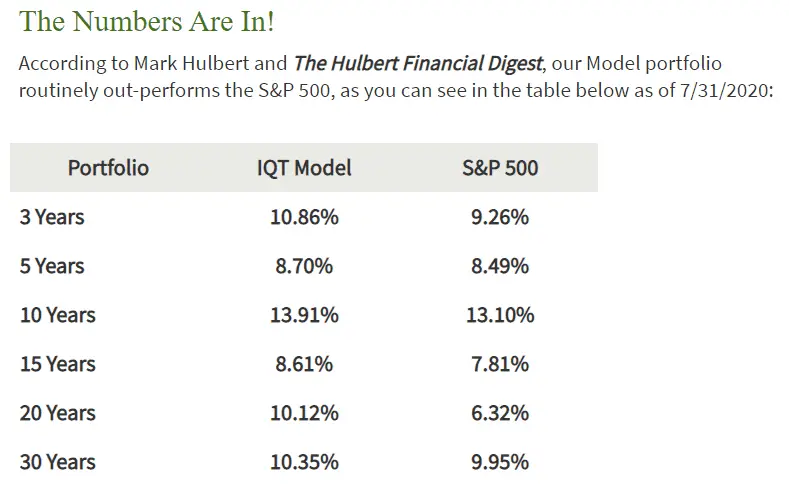
Source: Investment Quality Trends Newsletter Performance
Please keep in mind that this article isn’t meant to be an endorsement for IQT. I just like the example because they’ve been around since the mid-1980s.
As the great Benjamin Graham said in his book, The Intelligent Investor:
“The underlying principles of sound investment should not alter from decade to decade”.
If you are looking for a reliable valuation tool, ideally you want one, like dividend yield, that has been shown to work for many decades and in all types of markets.
Bottom line: Using dividend yield as a stock valuation tool seems to work and it’s been working for a long time.
That said, no valuation method is perfect. When using dividend yield as a valuation tool there are 4 drawbacks to be aware of.
4 Dividend Yield Theory Drawbacks
Drawback #1 Not as reliable for consistently low-yielding stocks.
Consistently low-yielding stocks don’t attract investors looking for income as much.
As the focus of investors and management for low-yield stocks is typically less on the dividend, it means the dividend yield is less reliable as a valuation tool.
Consider looking at a few different valuation measures (P/E, P/B, etc.) as a supplement to the dividend yield method. This is also good advice in general.
All valuation methods have their flaws so looking at a few different methods is a good habit.
Drawback #2 Not as reliable for dividend stocks with short dividend histories.
Ideally, you want a 25-year history of uninterrupted dividends, but a decade is still probably OK.
Anything shorter than this and the results are less reliable as there isn’t enough dividend yield data yet to properly analyze dividend yield trends.
Say for example you have a stock that’s been paying dividends for 5 years but those 5 years are all during a bull (up) market.
When the next recession or market crash hits the stock will likely fall with the rest of the market and a new high dividend yield will be created.
Because the stock hasn’t gone through a couple of market crashes it is hard to get a sense of what its true high yield limit might be.
This is where time is your friend.
With a decade to a quarter-century of dividend payments you get a clearer sense of what the upper and lower yield limits are.
These upper and lower limits can be used to help decide when the stock is over or under-valued.
After all, history doesn’t always repeat, but it rhymes.
As I mentioned in flaw/drawback #1, a good antidote to stocks with short dividend histories is to look at other valuation measures (P/E, P/B, etc.) to supplement the dividend yield method.
Drawback #3 Very High Dividend Yields Can Be Deceiving
Very high yields can be a warning sign that the dividend might be cut.
Morningstar put it well:
“As with all valuation ratios, dividend yield must be used with caution. Stocks with very high dividend yields might seem like bargains, but these companies are often going through financial problems that have caused their stock price to plunge. It’s not unusual for companies in such situations to cut their dividend in order to save cash, so their actual dividend yield going forward might be lower than the currently reported figure.”
Source: Morningstar Course 402: Using Ratios and Multiples – Dividend Yield
Drawback #4 Can’t be used for stocks that don’t pay a dividend.
The last drawback of the dividend yield theory is a fairly obvious one.
If you want to use dividend yield as a valuation tool for a stock that doesn’t pay a dividend, it’s not going to work for you!
3 Bonuses: Where to find yield charts
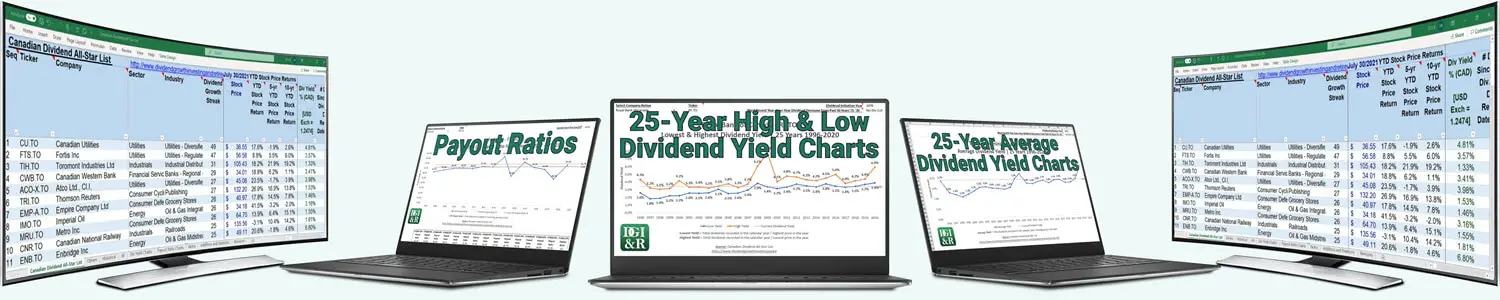
Bonus #1: 25-year low, average and high dividend yield charts in the Canadian Dividend All-Star List spreadsheet.
You can find tons (100+) of 25-year dividend yield charts like the two shown below in the “Div Yield Charts” tab of the Canadian Dividend All-Star List spreadsheet.
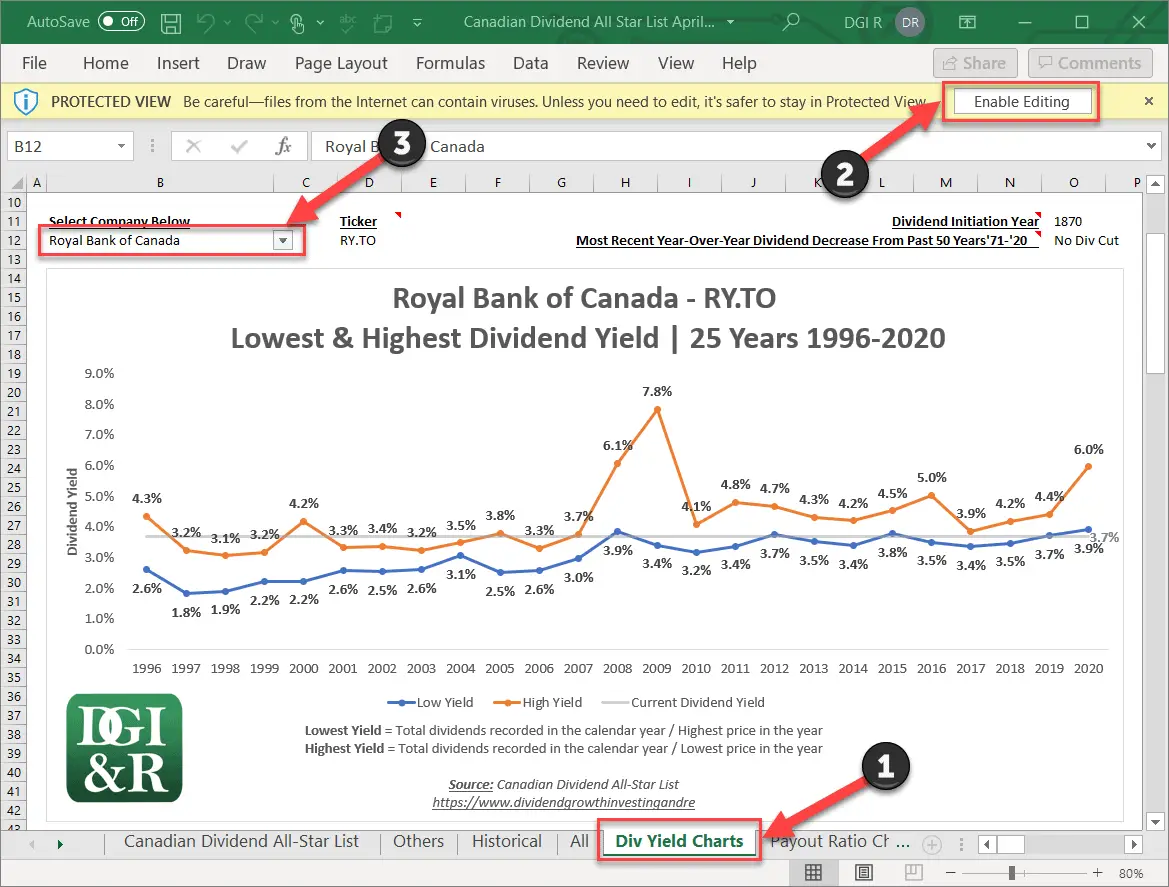
Source: April 30, 2021 Canadian Dividend All-Star List

Source: April 30, 2021 Canadian Dividend All-Star List
If you want the latest version of the Canadian Dividend All-Star List spreadsheet sign up for free below.
You’ll need Excel 2007 or later to access the yield charts in this spreadsheet. If you don’t have Excel take a look at Bonus #2.
I also recommend reading the 100 Canadian Dividend Yield Charts: 25-Year Low, Average & High Dividend Yield Charts page so you can learn;
- how to use these charts,
- how the yield is calculated in these charts, and
- some of the problems with how the yield has been calculated in these charts.
Video: How to Find the 25-Year History of Low, Average & High Dividend Yields with the Canadian Dividend All-Star List
Here is a short video on how to find these charts with the Canadian Dividend All-Star List
Bonus #2: 100 Canadian Dividend Yield Charts — 25-year low, average and high dividend yield charts
To access the 25-year dividend yield charts in the Canadian Dividend All-Star List spreadsheet you need Excel 2007 or later.
Not everyone has Excel, so I’m sharing these 25-year yield charts for 100 Canadian stocks in this article too:
100 Canadian Dividend Yield Charts: 25-Year Low, Average & High Dividend Yield Charts
That way if you don’t have Excel, you can still find 100+ 25-year dividend yield charts.
This page has yield charts for every Canadian stock that has increased dividends for 5 or more consecutive years in a row as of mid-2021.
Bonus #3: YieldCharts.com – US Dividend Yield Charts
If you are looking for dividend yield charts for US stocks, I found this website: https://www.yieldcharts.com/.
You’ll get a lot of ads on YieldCharts.com/ and it mainly focuses on US stocks, but it’s free and they show long 25-year periods in some cases.
Here’s a May 2021 screenshot of Johnson & Johnson’s (NYSE:JNJ) yield chart from this website.
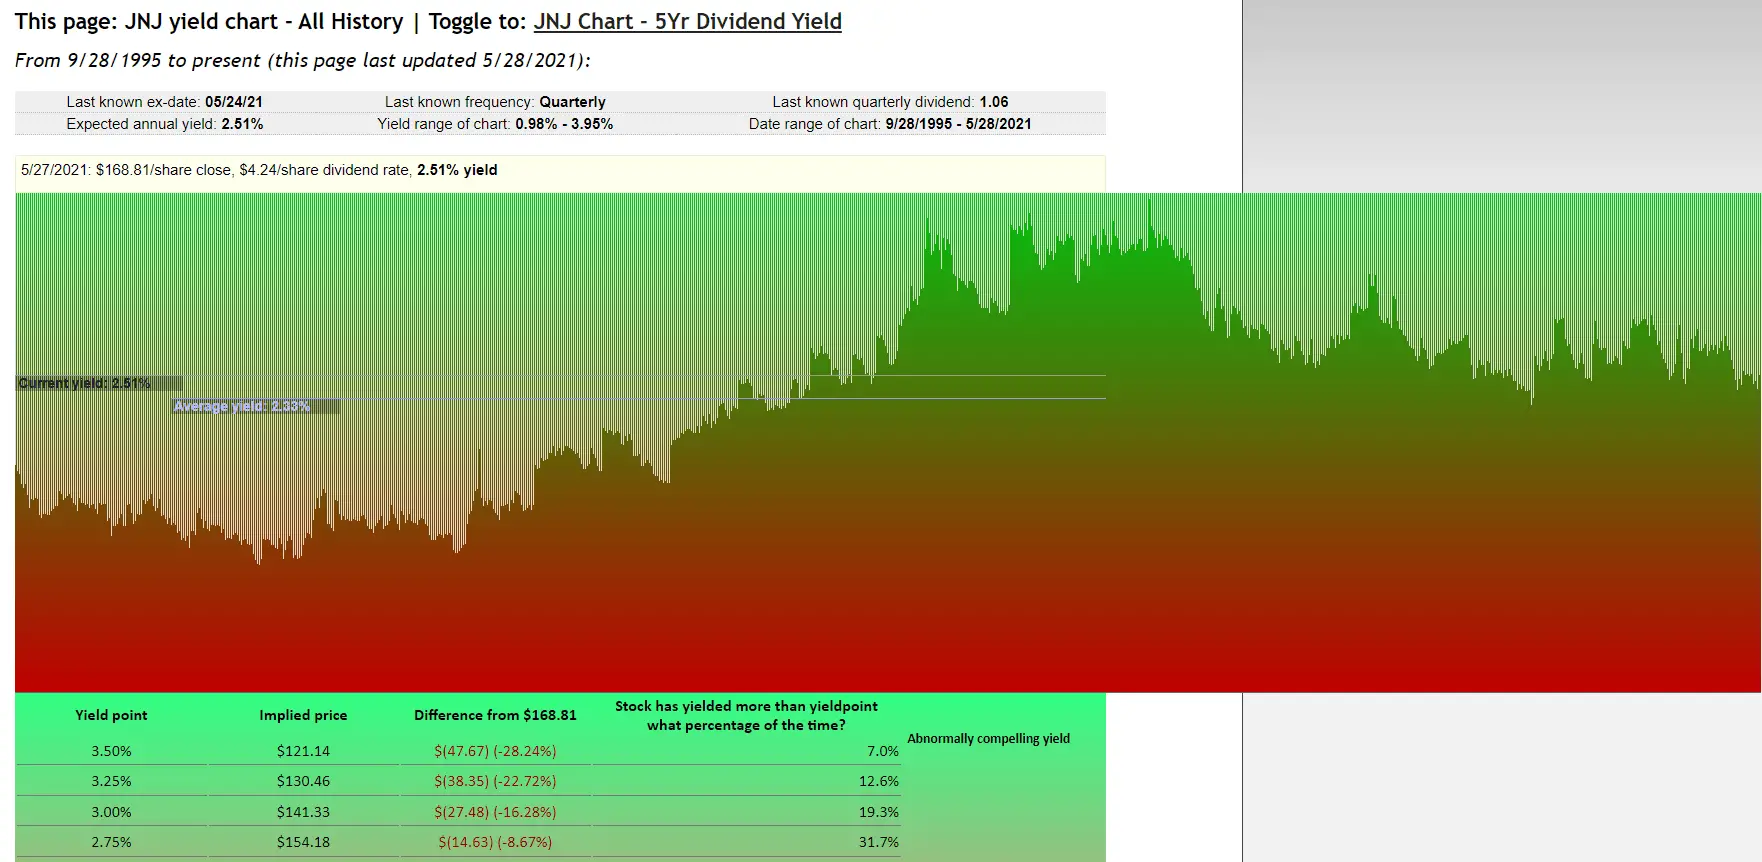
Source: https://www.yieldcharts.com/?symbol=Jnj
Extra Reading
If you are looking for more information on the dividend yield theory I found a good article here: https://www.simplysafedividends.com/intelligent-income/posts/1104-dividend-yield-theory-explained
Summary
Why should you use dividend yield as a valuation tool for stocks?
The answer is quite simple.
It works.
After all, investors have been using dividend yield as a valuation tool for over a century. If it didn’t work, we’d have stopped using it by now.
Additionally, the concept is easy to understand. When the dividend yield is historically high the stock is under-valued, and when the yield becomes historically low it is over-valued.
No valuation method is perfect though, so it’s important to be aware of some drawbacks.
4 Drawbacks When Using Dividend Yield As A Valuation Tool
- Not as reliable for consistently low-yielding stocks.
- Not as reliable for dividend stocks with short dividend histories.
- Very High Dividend Yields Can Be Deceiving
- Can’t be used for stocks that don’t pay a dividend.
Newsletter Sign-Up & Bonus
Have you enjoyed our content?
Then subscribe to our newsletter and you'll be emailed more great content from Dividend Growth Investing & Retirement (DGI&R).
BONUS: Subscribe today and you'll be emailed the most recent version of the Canadian Dividend All-Star List (CDASL).
The CDASL is an excel spreadsheet with an abundance of useful dividend screening information on Canadian companies that have increased their dividend for five or more years in a row.
The CDASL is one of the most popular resources that DGI&R offers so don't miss out!