Dividend Growth Investing & Retirement is supported by its readers through donations and affiliate links. If you purchase through a link on my site, I may earn a commission. Thanks! Learn more.
My investing plan involves buying and hopefully holding great dividend growth companies for a long period of time while collecting the growing stream of dividends that will eventually help cover retirement costs and inflation. For this strategy to work I need companies to be able to survive and thrive over the very long term. This is why, as a long term dividend growth investor, I place a lot of weight in the financial strength of a company before investing.
With that in mind I thought it would be interesting to come up with a laundry list of Canadian dividend growth stocks that exhibit signs of financial strength.
⭐ Find dividend growth stocks that have survived multiple recessions and increased dividends for 5, 10, 25+ years in a row.
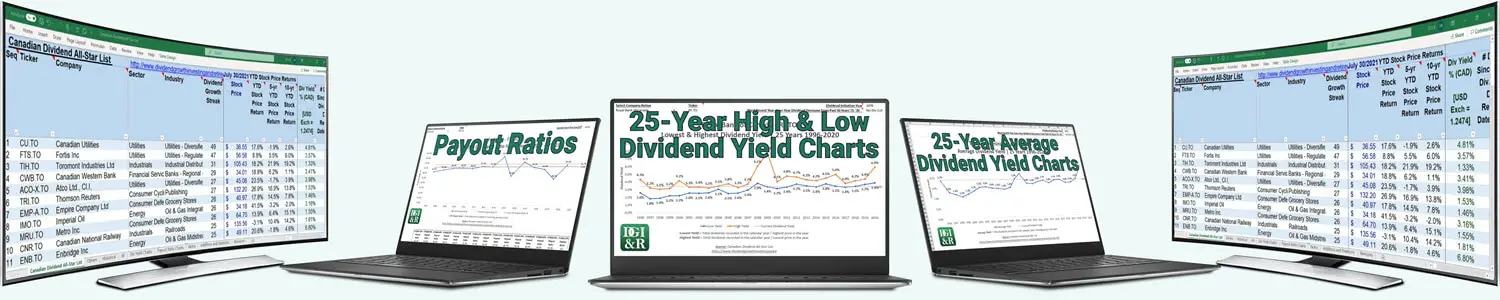
As a starting point I used the May 31, 2016 version of the Canadian Dividend All-Star List which is an excel spreadsheet of Canadian companies that have increased their dividend for five or more consecutive years in a row. Currently there are 88 companies in the list with a dividend streak of 5 years or more. I decided to make one exception and added Bank of Montreal [BMO.TO Trend] into the mix, bringing the total to 89.
We in Canada are known for our “Big 5” banks so I decided to add BMO as it was the only bank that wasn’t already on the list. BMO has a dividend streak of 4 years, a history of regular dividend increases and “BMO Financial Group is the longest-running dividend-paying company in Canada” (Source: BMO investor relations website).
What is a financially strong company?
I’m not going to go into too much detail here as I’ve already written an article on the topic, but ideally you are looking for a company with low debt, a reasonable or low payout ratio and reliable, strong and growing cash flows.
Related article: Financial Strength: A Key Element in High Quality Dividend Growth Stocks
For today’s purposes we are going to focus primarily on credit ratings and debt ratios to help whittle down our list. You can then use this list to further analyze other aspects of financial strength like the payout ratio and cash flows.
Credit Rating Passing Criteria
To quickly assess the financial strength of a company it is easiest to just look at the credit rating. Ideally I like to see a credit rating of BBB+ or higher from S&P. S&P doesn’t cover all the Canadian companies in my list so I looked up the credit rating for each company in the list from four rating agencies: S&P, DBRS, Moody’s and Fitch. The table below highlights in green the ratings that I consider a passing grade from the four agencies.
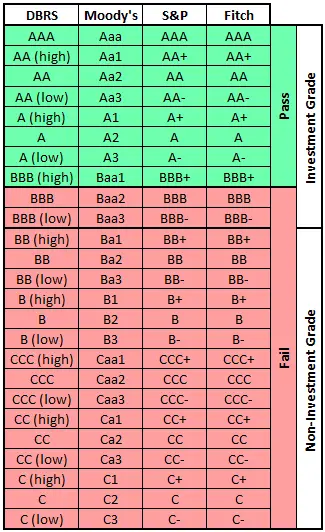
When a company had more than one credit rating I chose the lowest of the available options. I’ll use Royal Bank of Canada [RY.TO Trend] as an example. They were rated AA by DBRS, AA- by S&P, Aa3 by Moody’s, and AA by Fitch. The Aa3 from Moody’s and AA- from S&P were the lowest of the four, but Moody’s had a negative outlook whereas S&P had a stable outlook so the Moody’s rating was picked.
Some companies in the list are small companies and others have no debt which can sometimes mean they are not rated by one of the four agencies. In cases where there wasn’t a credit rating from any of the four agencies I used two debt ratios to grade the companies.
Debt Ratios Passing Criteria
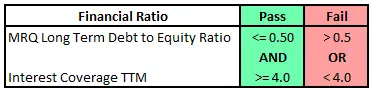
To pass my financial strength test I required an interest coverage ratio of 4:1 or higher and a long term debt/equity ratio of 50% or less.
I decided on a debt/equity ratio requirement of 50% or less as Lowell Miller lists it as one of his financial strength requirements in his book The Single Best Investment: Creating Wealth with Dividend Growth.
For small non-financial companies an interest coverage ratio of 4:1 is generally thought to be about equivalent to a BBB rating. In January 2016, Aswath Damodaran ran the data on the link between interest coverage ratios and credit ratings by looking at all rated companies in the United States. The results for non-financial service companies with a market cap of less than $5 billion are highlighted in the table below.
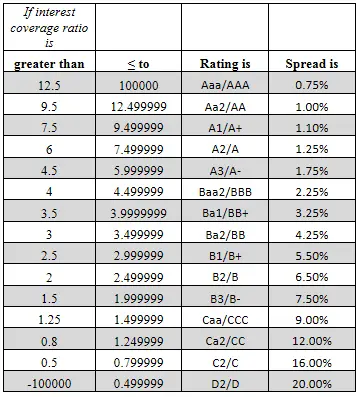
Source: http://pages.stern.nyu.edu/~adamodar/New_Home_Page/datafile/ratings.htm
The table above doesn’t specify an equivalent interest coverage ratio to a BBB+ rating, but BBB is pretty close. I think between the debt/equity and interest coverage ratios we are around a similar pass level to the BBB+ credit rating, albeit we are using a much cruder method than the rating agencies use.
The Results
Of the 89 companies I looked at 47 passed with the other 42 failing. One thing that surprised me was the number of companies with no long term debt at all. In total there were 8 companies without any long term debt.
I had limited space on the website so I’ve also included an excel spreadsheet that has a bit more information like all of the credit ratings, not just the lowest. Download it here: Financially Strong Canadian Dividend Growth Stocks & Their Credit Ratings May 31, 2016.
Without further ado here are the results sorted by dividend streak length. Hopefully you find the list a useful starting point for further analysis.
| Company | Ticker | Div Streak | Pass / Fail | Lowest Rating | Financial Ratios | Source Links | ||||||
|---|---|---|---|---|---|---|---|---|---|---|---|---|
| Credit Rating | Outlook / Trend | MRQ LT Debt / Equity | Interest Coverage TTM | D | S | M | F | C | ||||
| Canadian Utilities | CU.TO | 44 | Pass | A | Neg | n/a | n/a | D | S | C | ||
| Fortis Inc | FTS.TO | 42 | Pass | A (low) | UR – Neg | n/a | n/a | D | S | |||
| Canadian Western Bank | CWB.TO | 24 | Pass | A (low) | Stb | n/a | n/a | D | C | |||
| Atco Ltd., Cl.I, | ACO-X.TO | 22 | Pass | A (low) | Stb | n/a | n/a | D | S | C | ||
| Thomson Reuters | TRI.TO | 22 | Pass | BBB (high) | Stb | n/a | n/a | D | S | F | ||
| Empire Company Ltd* | EMP-A.TO | 21 | Fail | n/a | n/a | C | ||||||
| Sobeys Inc. (EMP-A.TO Subsidiary) | BBB (low) | Stb | n/a | n/a | D | S | C | |||||
| Ensign Energy Services | ESI.TO | 21 | Fail | 0.3 | -5.98 | |||||||
| Imperial Oil | IMO.TO | 21 | Pass | AA (high) | Neg | n/a | n/a | D | S | |||
| Metro Inc | MRU.TO | 21 | Fail | BBB | Stb | n/a | n/a | D | S | |||
| Canadian National Railway | CNR.TO | 20 | Pass | A | Stb | n/a | n/a | D | S | M | ||
| Enbridge Inc | ENB.TO | 20 | Fail | Baa2 | Stb | n/a | n/a | D | S | M | C | |
| Home Capital Group* | HCG.TO | 17 | Fail | BBB- | Stb | n/a | n/a | D | S | C | ||
| Home Trust Company (HCG.TO Subsidiary) | BBB | Stb | n/a | n/a | D | S | ||||||
| Saputo Inc. | SAP.TO | 16 | Pass | Baa1 | Stb | n/a | n/a | D | M | |||
| Canadian Natural Resources | CNQ.TO | 15 | Pass | BBB (high) | Neg | n/a | n/a | D | S | M | C | |
| SNC-Lavalin | SNC.TO | 15 | Fail | BBB | Neg | n/a | n/a | D | S | C | ||
| Transcanada Corp. | TRP.TO | 15 | Pass | Baa1 | Stb | n/a | n/a | S | M | C | ||
| TransCanada PipeLines Limited (TRP.TO Subsidiary) | A (low) | UR | n/a | n/a | D | S | M | C | ||||
| Canadian REIT | REF-UN.TO | 14 | Fail | BBB | Stb | n/a | n/a | D | ||||
| CCL Industries Inc | CCL-B.TO | 14 | Fail | 0.63 | 15.82 | |||||||
| Finning International | FTT.TO | 14 | Pass | BBB (high) | Stb | n/a | n/a | D | S | C | ||
| Royal Gold Inc. | RGL.TO | 14 | Fail | 0.28 | 0.22 | |||||||
| Transcontinental Inc | TCL-A.TO | 14 | Fail | BBB (low) | Stb | n/a | n/a | D | S | C | ||
| Corus Entertainment | CJR-B.TO | 13 | Fail | n/a | n/a | D | S | |||||
| Pason Systems Inc | PSI.TO | 13 | Pass | No LT Debt | No LT Debt | |||||||
| Plaza Retail REIT | PLZ-UN.TO | 13 | Fail | 1.07 | 2.01 | |||||||
| Ritchie Bros Auct | RBA.TO | 13 | Pass | 0.08 | 37.08 | |||||||
| Shaw Communications | SJR-B.TO | 13 | Fail | BBB- | Neg | n/a | n/a | D | S | M | ||
| Suncor Energy Inc | SU.TO | 13 | Pass | Baa1 | Stb | n/a | n/a | D | S | M | ||
| Cogeco Cable Inc | CCA.TO | 12 | Fail | BB (high) | Stb | n/a | n/a | D | S | C | ||
| Computer Modelling Group | CMG.TO | 12 | Pass | No LT Debt | No LT Debt | |||||||
| Telus Corporation | T.TO | 12 | Pass | Baa1 | UR | n/a | n/a | D | S | M | F | C |
| Cogeco Inc | CGO.TO | 11 | Fail | n/a | n/a | C | ||||||
| Cogeco Communications Inc. (CGO.TO Subsidiary) | BB (high) | Stb | n/a | n/a | D | F | C | |||||
| Intact Financial | IFC.TO | 11 | Pass | Baa1 | Pos+ | n/a | n/a | D | M | F | C | |
| Rogers Communications Inc | RCI-B.TO | 11 | Fail | BBB | Stb | n/a | n/a | D | S | M | F | C |
| Shawcor Ltd | SCL.TO | 11 | Pass | 0.43 | 5.62 | |||||||
| Stella-Jones Inc. | SJ.TO | 11 | Fail | 0.64 | 12.75 | |||||||
| Accord Financial Corp. | ACD.TO | 10 | Fail | 0.94 | n/a | |||||||
| Andrew Peller Ltd. | ADW-A.TO | 10 | Pass | 0.3 | 5.56 *MRQ | |||||||
| Exco Technologies Ltd | XTC.TO | 10 | Pass | 0.27 | 61.02 *MRQ | |||||||
| Gluskin Sheff + Associates | GS.TO | 10 | Pass | No LT Debt | No LT Debt | |||||||
| Boyd Group Income Fund | BYD-UN.TO | 9 | Fail | 0.65 | 1.69 | |||||||
| Emera Incorporated | EMA.TO | 9 | Pass | BBB+ | Neg | n/a | n/a | S | C | |||
| Enghouse Systems Limited | ESL.TO | 9 | Pass | No LT Debt | 102.42 | |||||||
| Evertz Technologies Ltd. | ET.TO | 9 | Pass | 0 | 196.32 | |||||||
| Jean Coutu Group | PJC-A.TO | 9 | Pass | No LT Debt | No LT Debt | |||||||
| Alaris Royalty Corporation | AD.TO | 8 | Pass | 0.18 | 19.17 | |||||||
| Brookfield Infrastructure Partners LP | BIP-UN.TO | 8 | Pass | BBB+ | Stb | n/a | n/a | S | ||||
| CAE Inc | CAE.TO | 8 | Fail | 0.64 | 5.88 | |||||||
| Franco-Nevada Corp | FNV.TO | 8 | Pass | No LT Debt | No LT Debt | |||||||
| High Liner Foods Inc | HLF.TO | 8 | Fail | B+ | Stb | n/a | n/a | S | M | |||
| Lassonde Industries Inc. | LAS-A.TO | 8 | Fail | 0.63 | 6 | |||||||
| Laurentian Bank Of Canada | LB.TO | 8 | Fail | BBB | Stb | n/a | n/a | D | S | |||
| Tecsys Inc. | TCS.TO | 8 | Pass | 0.1 | 12.93 | |||||||
| BCE Inc | BCE.TO | 7 | Fail | Baa2 | Stb | n/a | n/a | D | S | M | ||
| Genworth MI Canada Inc | MIC.TO | 7 | Pass | BBB+ | Stb | n/a | n/a | D | S | C | ||
| Inter Pipeline | IPL.TO | 7 | Pass | BBB (high) | Stb | n/a | n/a | D | S | C | ||
| Alimentation Couche-Tard Inc | ATD-B.TO | 6 | Fail | Baa2 | Stb | n/a | n/a | S | M | |||
| Brookfield Renewable Energy Partners LP | BEP-UN.TO | 6 | Fail | BBB | Stb | n/a | n/a | D | S | |||
| CI Financial Corp. | CIX.TO | 6 | Pass | A (low) | Stb | n/a | n/a | D | S | |||
| Domtar Corp | UFS.TO | 6 | Fail | BBB (low) | Stb | n/a | n/a | D | S | M | ||
| Magna International Inc | MG.TO | 6 | Pass | Baa1 | Pos+ | n/a | n/a | D | S | M | ||
| National Bank | NA.TO | 6 | Pass | A | Stb | n/a | n/a | D | S | M | F | C |
| Richelieu Hardware Ltd. | RCH.TO | 6 | Pass | 0 | High | |||||||
| Westjet Airlines Ltd. | WJA.TO | 6 | Fail | BBB- | Stb | n/a | n/a | S | M | |||
| Agrium Inc. | AGU.TO | 5 | Fail | BBB | Stb | n/a | n/a | D | S | M | ||
| Aimia Inc. | AIM.TO | 5 | Fail | BBB (low) | Stb | n/a | n/a | D | ||||
| Algonquin Power & Utilities Corp. | AQN.TO | 5 | Fail | BBB (low) | UR | n/a | n/a | D | ||||
| Bank of Nova Scotia | BNS.TO | 5 | Pass | A+ | Stb | n/a | n/a | D | S | M | F | C |
| Canadian Imperial Bank of Commerce | CM.TO | 5 | Pass | A+ | Stb | n/a | n/a | D | S | M | F | C |
| Canadian Tire Corp Ltd A Nvtg | CTC-A.TO | 5 | Pass | BBB (high) | Stb | n/a | n/a | D | S | C | ||
| Cineplex Inc. | CGX.TO | 5 | Fail | 0.54 | 9.59 | |||||||
| Corby Spirit and Wine Ltd | CSW-A.TO | 5 | Pass | No LT Debt | No LT Debt | |||||||
| Dollarama Inc. | DOL.TO | 5 | Fail | BBB | Stb | n/a | n/a | D | ||||
| Enbridge Income Fund Holdings Inc. | ENF.TO | 5 | Fail | Baa2 | Stb | n/a | n/a | D | M | C | ||
| Enercare Inc. | ECI.TO | 5 | Pass | n/a | n/a | |||||||
| EnerCare Solutions Inc. (ECI.TO Subsidiary) | BBB (high) | UR – Neg | n/a | n/a | D | |||||||
| Enerflex Ltd | EFX.TO | 5 | Pass | 0.48 | 8.37 *MRQ | |||||||
| Equitable Group Inc | EQB.TO | 5 | Fail | BBB (low) | Stb | n/a | n/a | D | ||||
| Equitable Bank (EQB.TO Subsidiary) | BBB | Stb | n/a | n/a | D | |||||||
| Exchange Income Corporation | EIF.TO | 5 | Fail | 1.31 | 3.57 | |||||||
| Gibson Energy Inc. | GEI.TO | 5 | Fail | Ba2 | Stb | 1.1 | -2 | M | C | |||
| Gildan Activewear Inc. | GIL.TO | 5 | Pass | 0.28 | 36.96 | |||||||
| Granite Real Estate Investment Trust | GRT-UN.TO | 5 | Fail | BBB | Stb | n/a | n/a | D | M | C | ||
| IGM Financial Inc | IGM.TO | 5 | Pass | A | Stb | n/a | n/a | D | S | |||
| Keyera Corp. | KEY.TO | 5 | Fail | 1.03 | 6.47 | |||||||
| Methanex Corp | MX.TO | 5 | Fail | BBB- | Neg | n/a | n/a | S | M | F | C | |
| Nevsun Resources Ltd | NSU.TO | 5 | Pass | No LT Debt | 43.49 | |||||||
| Royal Bank of Canada | RY.TO | 5 | Pass | Aa3 | Neg | n/a | n/a | D | S | M | F | C |
| Russel Metals Inc | RUS.TO | 5 | Fail | Ba3 | Neg | n/a | n/a | M | C | |||
| Toronto Dominion Bank | TD.TO | 5 | Pass | AA- | Stb | n/a | n/a | D | S | M | F | C |
| Transforce Inc. | TFI.TO | 5 | Fail | 0.58 | 4.46 | |||||||
| Bank of Montreal | BMO.TO | 4 | Pass | A+ | Stb | n/a | n/a | D | S | M | F | C |
| Pass Total | 47 | |||||||||||
| Fail Total | 42 | |||||||||||
| Legend/Key | ||||||||||||
| Neg = Negative | Pos+ = Positive | Stb = Stable | UR = Under Review | D = DBRS | ||||||||
| F = Fitch | M = Moody’s | S = S&P | C = Company Credit Rating Website Link | |||||||||
| LT = Long Term | MRQ = Most Recent Quarter | TTM – Trailing Twelve Months | ||||||||||
| No LT Debt = Ratio couldn’t be calculated as the company doesn’t have any long term debt. | ||||||||||||
| Sources | ||||||||||||
| Credit Ratings – DBRS, S&P, Moody’s and Fitch. | ||||||||||||
| Financial Ratios – Primarily MorningStar Ratios (MRQ Debt to Equity and TTM Interest Coverage). When MorningStar TTM interest coverage ratio was missing, the MRQ ratio from the Wall Street Journal Financials section was used. | ||||||||||||
Disclosure: I own shares of Bank of Nova Scotia, Canadian Utilities, Canadian Western Bank, Enbridge Inc., Ensign Energy Services, Home Capital Group Inc., National Bank of Canada, Rogers Communications, and Suncor Energy. You can see my portfolio here.
Newsletter Sign-Up & Bonus
Have you enjoyed our content?
Then subscribe to our newsletter and you'll be emailed more great content from Dividend Growth Investing & Retirement (DGI&R).
BONUS: Subscribe today and you'll be emailed the most recent version of the Canadian Dividend All-Star List (CDASL).
The CDASL is an excel spreadsheet with an abundance of useful dividend screening information on Canadian companies that have increased their dividend for five or more years in a row.
The CDASL is one of the most popular resources that DGI&R offers so don't miss out!

![Screening the Canadian Market for the #1 Dividend Growth Utility Stock [Spreadsheet included]](https://dividendgrowthinvestingandretirement.com/wp-content/uploads/2018/05/Canadian-Utility-Dividend-Growth-Screen-Cover.png)

Great work. Thanks for the research.
thanks for sharing! Debt & credit rating info. presented is extremely useful. Interesting too that some of the perpetual blue-chippers ( BCE, ENB, etc.) don’t meet the threshold that you set.
Currently holding and receiving dividend income streams from some of the ‘fails’ but your exercise is an terrific reminder that risk increases when enterprises increase underlying debt leverage. Cyclical focused situations add another level of uncertainty.
Debt sucks. Reduced dividend payments and suspensions aren’t wonderful as well. Your exercise and credit screening criteria should help avoid some of those potential glitches. Excellent info!
Thanks Richard!
Yeah BCE and ENB are close at BBB, but not quite BBB+. Another example is Rogers Communications Inc (RCI.B). I think Rogers is a good example of why checking financial strength before investing is important as they recently decided to keep their dividend steady instead of raising like most were expecting (myself included). One of their reasons for not increasing the dividend was to help pay down debt.
Another example is Kinder Morgan Inc. (KMI). They where rated BBB- and were at risk of losing their investment grade status so they cut the dividend. In KMI’s case I didn’t follow my own advice and got stung by the yield trap.
Like you I’m also holding some of the fails in the list, specifically Rogers Communications, Enbridge, Ensign Energy Services and Home Capital Group.
Cheers,
DGI&R.
Just what I’ve been looking for. Would be nice to show current dividend yield and payout ratio in the spreadsheet.
Thanks so much for all the work!
This is awesome work. I am a big fan of yours since I started to seriously investing and I am learning a lot with you. Thank you again
this credit rating analysis should be done more often
TIA!