Dividend Growth Investing & Retirement is supported by its readers through donations and affiliate links. If you purchase through a link on my site, I may earn a commission. Thanks! Learn more.
Before I start the dividend stock analysis I want to mention to new readers that there is another article that you may want to read first. The other article better explains what I’m looking for in a company from a dividend growth perspective and why I analyze specific company components and ratios. The other article is meant more as an educational tool so that readers can better understand my dividend stock analyses. This dividend stock analysis will look at the company to identify if it is a good dividend growth candidate to invest in.
Walmart Dividend Stock Analysis
Company Description
From Google Finance:
“Wal-Mart Stores, Inc. (Walmart) operates retail stores in various formats around globally. Everyday low prices (EDLP) is the Company’s pricing philosophy under, which it price items at a low price everyday. The Company’s operates in three business segments: the Walmart U.S. segment, the Walmart International segment, and the Sam’s Club segment. During the fiscal year ended January 31, 2012 (fiscal 2012), its Walmart U.S. segment accounted for approximately 60% of its net sales and operates retail stores in various formats in all 50 states in the United States and Puerto Rico, as well as Walmart’s online retail operations, walmart.com. Its Walmart International segment consists of retail operations in 26 countries. Its Sam’s Club segment consists of membership warehouse clubs operated in 47 states in the United States and Puerto Rico, as well as the segment’s online retail operations, samsclub.com. During 2012, Sam’s Club accounted for approximately 12% of its net sales.”
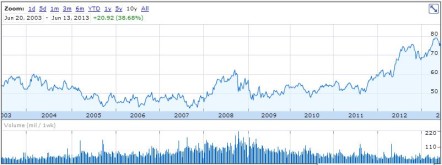
10 Year Stock Chart
The 10 year annual average return is 3.3%. With the dividend payments paid over the last 10 fiscal years (Total dividends of $9.33) then the total average annual return would be 4.5% with the average return from dividends representing 1.2%.
The 10 year returns haven’t been that good with the stock chart looking mostly flat until recently. Walmart looks to be a culprit of the lost decade.
Revenue and Earnings
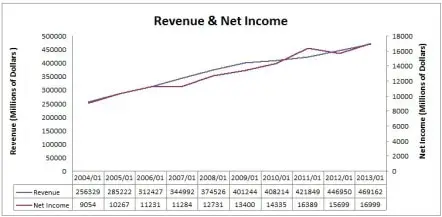
Walmart has been making more and more revenue each year. This is exactly the kind of chart I like to see.
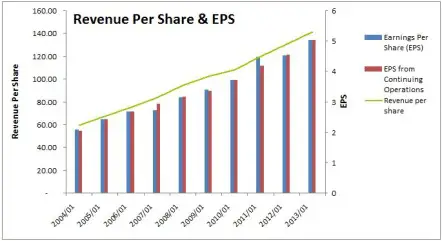
The same steady trend up emerges when revenue per share and EPS are examined.
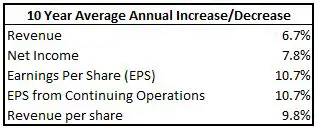
While Walmart has very impressive revenue charts the average annual growth rates are not quite where I’d want them. Typically I like to see growth rates above 8%, but revenue and net income are slightly below these levels.
While Revenue and Net Income growth isn’t quite where I’d want it, the consistency of Walmart’s earnings growth is superb.
Dividends
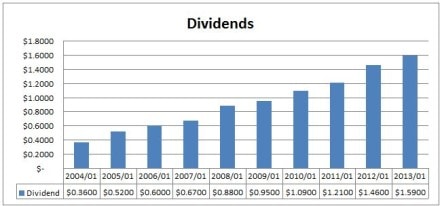
Walmart has increased their dividend for 39 consecutive years in a row with their most recent increase occurring with the dividend recorded in December 2012 when they increased the quarterly dividend by 18.2% from $0.3975 to $0.4700.
The chart shows a steadily increasing dividend, exactly what I like to see from a dividend growth perspective.
Dividend Growth
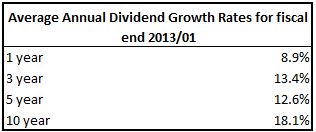
As you can see from the table below Walmart shows good average annual dividend growth rates.
With the most recent dividend increase of 18.2% it looks like they plan on continuing high levels of dividend growth. Now let’s see if the dividend is sustainable.
Dividend Sustainability
The 10 year average annual dividend growth has been significantly higher than EPS growth which suggests that eventually dividend growth should slow down.
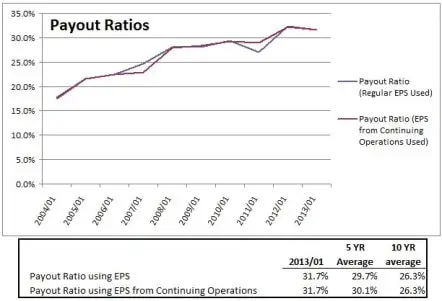
Let’s take a look at the payout ratio to see how much room for growth the dividend still has.
The company has been increasing dividends faster than earnings, but because they have a reasonable payout ratio the dividend is sustainable and there is still plenty of room for further increases.
Estimated Future Dividend Growth
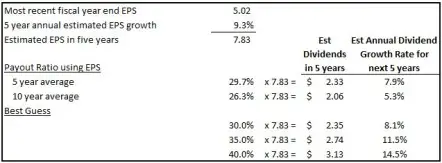
Analysts expect annual EPS growth to be 9.29% for the next 5 years. Accepting this EPS growth rate and using various payout ratios we can guess future dividend growth rates.
Walmart’s payout ratio has been steadily increasing, and I expect this trend to continue. I’d guess that payout ratios in 5 years will be around 30% to 40%. This would result in annual dividend growth ranging from 8.1% to 14.5%. The most recent increase was 18.2%, so my guess is that dividend growth will be on the higher side of this range. Because Walmart’s payout ratio has been steadily increasing it is hard to guess management’s target payout ratio. In these cases it is harder to predict future dividend growth.
Competitive Advantage & Return on Equity (ROE)
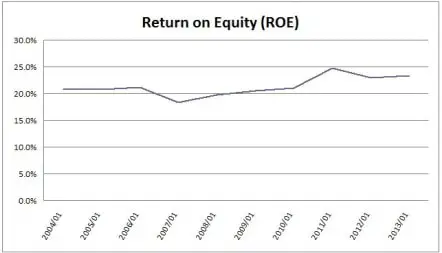
I would consider Walmart to have a wide moat over the competition and the ROE chart would support this as Walmart has a consistently good ROE. I like to see rates consistent or growing and Walmart’s ROE is usually around 20% or higher which is a strong indicator of a competitive advantage.
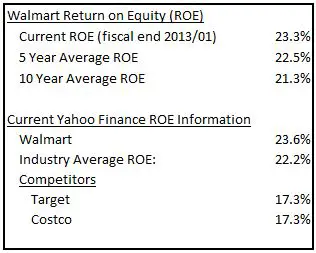
Looking at the table below, I can see that right now its ROE is slightly above the industry average for department stores. While they are only slightly above the industry average I was surprised to see that Walmart’s ROE is about 6 percentage points higher than both Target and Costco who I consider major competitors.
Debt & Liquidity
I want to invest in companies that are fiscally responsible, so it is important to look at debt levels and see that they are at reasonable levels. The debt to equity ratio looks fine, but I like to see the current and quick ratio above 1.0.
While initially I was a little worried about the current and quick ratios, I’m not anymore having looked at the past 10 years.
It looks like these ratios haven’t changed much over the past decade, so I’m happy they can operate at these levels. Fitch currently rates their debt at AA levels, which is another good indicator. Overall I’m not worried about debt or liquidity for Walmart.
Shares Outstanding
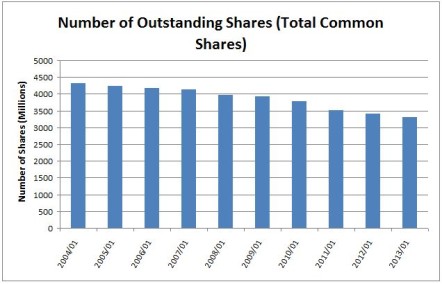
Shares outstanding have been steadily decreasing which is a good sign. I’d like to see this trend continue.
Valuation
I use the low price averages for 6 main ratios to determine a fair price: Yield, Discount/Premium of the low price compared to the Graham Price, P/E, P/B, P/Sales and P/Cash flow. I like to look at both EPS and EPS from continuing operations so it ends up being a total of 8 ratios as the Graham Price an P/E both use EPS. You can read more about my valuation method here.
I get the following for Walmart.
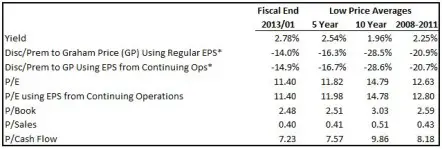
* The discount or premium to Graham Price hasn’t been calculated in the normal fashion. For the details read this article.
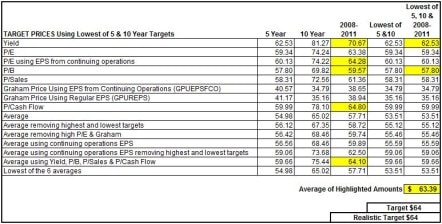
I use the averages from the previous table to determine my target price. Using these averages creates a lot of different target prices, so I back-test this strategy over the past 10 years. I identify which of the 8 valuation techniques would have given me a chance to buy the stock in two to three fiscal years in the past 10 fiscal years. It’s not always possible to test my strategy back 10 years, due to limited financial information, but I do my best. The results are highlighted below.
The average of the highlighted amount gives me a target price of $64. That would result in a dividend yield of 2.94%. It’s reasonable to think you could get a yield of almost 3% from Walmart, so I kept the realistic target price the same at $64.
Morningstar currently rates Walmart as a 3 star stock as it is currently priced around their estimated fair value of $74. For Morningstar to rate Walmart as a 5 star undervalued stock the price would have to fall below their “consider buy price” of $59.20. My target price is fairly close to this, which is another reason I kept my realistic target the same as the original calculated target of $64.
Trend Analysis
I also like to look at INO`s Free Trend Analysis prior to investing to see if I should hold off or not. Sometimes it is nice to see if the stock is trending down or up before buying it. For June 14, 2013 INO is showing a very weak downtrend for Walmart:
To see the most recent trend analysis for WalMart click here. INO also has a list of the top 50 trending stocks and free trading seminars and videos.
Other Investment Options in the Same Industry
I thought it would be good to compare Walmart to some other companies in the same industry that also have a strong dividend growth history. I had a look at the May 31, 2013 US Dividends Champions and found Costco, Family Dollar Stores, and Target.
Costco Wholesale has the lowest payout ratio and highest estimated 5 year average annual growth rates, but their dividend yield is well below my minimum entry yield of 2.0% to 2.5%. Their dividend growth rates in the past have been good and it looks like they’ll be able to continue strong dividend growth based on the low payout ratio and strong estimated 5 year annual growth of 13.4%.
Family Dollar Stores is in a similar situation as Costco. It’s a good dividend growth stock, but the entry yield is too low for me right now. Family Dollar Stores has a more impressive dividend streak with 37 years of consecutive dividend increases versus Costco’s 10 years. Like Costco I think Family Dollar Stores will be able to continue strong dividend growth and its most recent increase of 23.81% would support this.
Target has the longest dividend streak and looks to have the best overall past dividend growth rates. With the recent 20% dividend increase, good estimated earnings growth of 11.6%, and a low payout ratio of 33.8% it looks like this impressive dividend growth will continue. Target’s current yield is just over 2.0%, so I would consider investing if it was reasonably cheap. Unfortunately this is not the case right now. Morningstar currently has Target’s fair value as $58, and its five star “consider buy price” is $40.60. I will be staying on the sidelines for now as the current price is well above these levels.
I compared the five year average yields to the May 31, 2013 yields to see if any of the stocks looked significantly undervalued, but none of them did.
Walmart’s dividend yield was 14% above its average yield. Because this is just the average yield and not the highest yield average, 14% is not that great. The competitors all look to be around their averages, which suggests that none of these companies are valued priced.
When I look at these 4 companies I get roughly the same conclusion for all of them. They all look like good dividend growth candidates, but none of them are valued priced which would prevent me from investing.
Conclusion:
Walmart has a strong competitive advantage and wide economic moat. It makes more and more money each year without fail and has strong dividend growth fundamentals. This is exactly the type of stock I’d love to invest in. I think dividend growth will be a little bit higher than earnings. Estimated annual earnings growth is pegged at 9.3%, so my guess for dividend growth would be 10-15% annually. At current prices, Walmart is too rich for me, but if the price fell below my target price of $64 I would consider investing.
Disclaimer
I do not own any of the shares mentioned. You can see my portfolio here. I am a blogger and not a financial expert. These writings are my own opinions and should not be considered financial advice. Always perform your own due diligence before purchasing a stock. I mention target prices in this article, but this is not a recommendation to buy this stock, it is just a target price I use for my own personal investing that I have chosen to share.
Newsletter Sign-Up & Bonus

Have you enjoyed our content?
Then subscribe to our newsletter and you'll be emailed more great content from Dividend Growth Investing & Retirement (DGI&R).
BONUS: Subscribe today and you'll be emailed the most recent version of the Canadian Dividend All-Star List (CDASL).
The CDASL is an excel spreadsheet with an abundance of useful dividend screening information on Canadian companies that have increased their dividend for five or more years in a row.
The CDASL is one of the most popular resources that DGI&R offers so don't miss out!










And when, in this life, do you think WMT will close near $64? It’s an unrealistic entry point, imho.
I don’t know if I would say it’s unrealistic, I think a better word would be unlikely. My target prices are purposely conservative and are based on methods that would have only allowed you to buy the stock in 2 or 3 years of the past decade. I understand this is quite conservative, but it works for my investing style. I like to have a variety of good dividend growth companies on my watch list all with conservative targets. This means I’m not buying stocks very often, but when I do they are usually undervalued, which in the long term should benefit my portfolio. If it turns out that Walmart doesn’t drop below my target price, I’m OK with that as I can buy a different undervalued stock. I find this strategy also helps me preserve capital better. I understand that my strategy sometimes means that I’m unable to buy specific dividend growth stocks for years at a time, but with patience I feel this strategy will pay off.
US prices have been running up a lot over the past year and you could’ve bought Walmart in May 2012 or before for $64 or less. It came down to $67 in December 2012, which is fairly close, so I don’t think a $64 price is unrealistic in this case.
I am trying to understand what you mean by discount/prem to g # using ttm eps.
My calculation is always 5 or 7 year eps average and tangible book. Usin ttm eps and tangible book is skating on thin ice I think. And what discount are you using?
Here’s an article on how I determine my target prices.
I compare the low price to the calculated Graham Price (GP) to determine the discount or premium to GP. I calculate the GP using the square root of (22.5 x Book Value x EPS). For EPS in this formula I use the lesser of the 3 year EPS average or the current EPS. If the GP calculated is negative then I set the Discount/Premium to GP as -25%. The other ratios are calculated in the normal fashion.