Dividend Growth Investing & Retirement is supported by its readers through donations and affiliate links. If you purchase through a link on my site, I may earn a commission. Thanks! Learn more.

Finding the right dividend growth candidates to invest in can be very time consuming. There is so much information out there that it can become overwhelming. Today I’m going to talk about how I use Value Line’s Investment Survey reports to quickly see if a stock I’m interested in, warrants further research and potentially my money.
Most public libraries will have free access to these Value Line reports, but the Value Line website also provides free copies of these reports for companies in the the Dow 30. Coca-Cola [KO Trend Analysis] a well known dividend growth company happens to be in the Dow 30, so I’ll use their report as an example. The last Value Line Investment Survey report on Coca-Cola was updated on April 25, 2014. You can download the PDF file here to follow along. In this download, I’ve highlighted the areas on the report that I focus on.
⭐ Find dividend growth stocks that have survived multiple recessions and increased dividends for 5, 10, 25+ years in a row.
Dividend Yield
You’ll find dividend yield in the top right hand corner of the report.
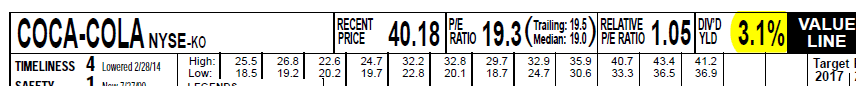
I typically like to see a dividend yield of at least 2.5%, but higher is better. If it’s over 6% I get wary that the dividend may not be sustainable. Even if the dividend yield is below 2.5% I’ll still continue to research the company a bit to get an idea if the company would be worth investing in, if the price dropped and the dividend yield increased above my 2.5% threshold. In Coca-Cola’s case this isn’t an issue as the yield is showing as 3.1%.
Financial Strength
In the bottom right hand corner of the report is the financial strength rating. I want to see a B+ or higher.
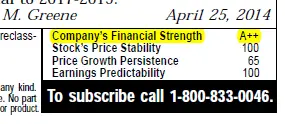
Coca-Cola has a A++ rating, so no problems here. It’s not surprising to see such a high rating considering the company has managed to increase dividends for over 50 years in a row.
Related article: Financial Strength: A Key Element in High Quality Dividend Growth Stocks
Checking for Consistent Earnings Growth
Next I look at the sales, cash flow and earnings history, with my main focus on earnings. I like to look over the past 10 years to see if earnings has consistently increased. You can see from below that Coca-Cola had only one year (2009) in the past decade where earnings per share was lower than the previous year’s. If there are only one or two years out of ten that had lower EPS, then I will usually consider the company to have a good consistent EPS trend.
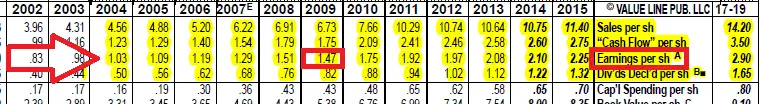
Simply looking at the annual EPS amounts isn’t enough, as you need to know the actual annual growth rates as well. This is why I usually look at this area in conjunction with the Annual Rates table which is in the middle left of the report.
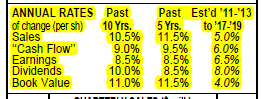
Using these two areas you can quickly determine if the company has the type of earnings profile that you want. Typically you want to see that the company has increased earnings in the past by 5-10% at a minimum. You are looking for the same level of growth from sales and cash flow as well. In Coca-Cola’s case they managed to increase earnings at an annual average rate of 8.5% for the past 5 and 10 years which is good.
What I really like about Value Line is they include 5 year growth projections. As a dividend growth investor I find this information very valuable. I find that other stock reports don’t often include dividend growth projections. I’m trying for 8% dividend growth in my portfolio, which coincidently is what Value Line is projecting for Coca-Cola. I also want to see that earnings will grow by at least 8% so that dividend growth is sustainable long term.
In Coca-Cola’s case earnings growth is projected at 6.5%, which is a little lower than the projected dividend growth. While this is lower than the 8% I look for, Coca-Cola is a dividend growth king, so this wouldn’t dissuade me from investing. So while I have target growth rates, I am still a bit flexible depending on the company. That said, when it comes to projected dividend growth I typically won’t go below 6%.
Related articles: Can Past Dividend Growth Rates Be Relied Upon To Predict Future Rates?, How to Estimate Future Dividend Growth (Part 1 of 2) and How to Estimate Future Dividend Growth (Part 2 of 2)
Payout Ratio
Next we want to make sure that the dividend is sustainable, so we’ll take a look at the payout ratio. I want to see a rate of 60% or less in most cases. I’m will to go up to 70% if it is a utility or telecom.

For Coca-Cola they had a payout ratio of 53% for 2013, so they are under my 60% threshold. I also like to take a quick look at the past payout ratios to see if I can get an idea of what the company’s target payout ratio is. This can make predicting dividend growth easier. In Coca-Cola’s case it looks like they typically payout around 50% to 60% of earnings.
I also like to look at the projected payout ratios as this relates to their dividend growth projections. Basically I want to see that the projected payout ratios are also below my 60% threshold. If the projected payout ratios are significantly higher then current levels then it indicates that the earnings growth is expected to be lower than dividend growth which is not a sustainable trend. I want dividend growth to be fuelled by increased earnings, not a higher payout ratio.
Average Annual Dividend
If after reviewing all the previous parts of the report I’m still interested in the stock I’ll take a look at the average annual dividend so that I can get a quick idea of a value price for the stock.
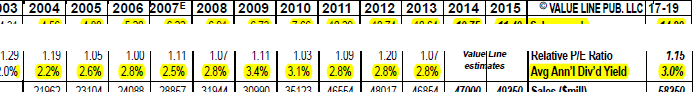
In Coca-Cola’s case the average annual dividend yield for the past decade has ranged from 2.2% to 3.4%, with it more recently around the 3% mark. I like to buy a stock when it is cheap, so I’d be looking to invest when the dividend yield is above the average. You’ll remember from the beginning that the dividend yield was at 3.1%, so this would indicate a fairly average price. Because I want to buy at bargain prices I’d wait for the price to drop before initiating a position.
Related article: Overcome Dividend Yield Valuation Flaws and Find Reasonable Target Prices Fast
I use the average annual dividend yield to get an idea of its fair value. When it comes time to actually pick my target buy price I get a lot more technical. I mostly use this area to see if the price is getting close to a point where I should calculate a target buy price. If the current dividend yield is at or below the average annual dividend yield I won’t bother coming up with a target price because I know it’s likely not bargain priced.
Conclusion
I find Value Line to be a very useful tool because it summarizes a lot of information all on one page, and it also provides dividend growth projections when a lot of other reports do not. I’ve only gone over the areas of the report that I use when quickly analyzing a dividend growth stock, but the report also provides other useful information.
Some of the notable information that I did not mention were Value Line’s Timeliness, Safety, Technical, Price Stability, Price Growth Persistence and Earnings Predictability ratings for the stock. The report also has company information like insider activity, the high and low stock prices for the past decade, profit margins, and a commentary on the current company results.
For those of you that have used Value Line before, what do you use the reports for?
Photo credit: Andrew Morrell Photography / Foter / Creative Commons Attribution-NoDerivs 2.0 Generic (CC BY-ND 2.0)
Newsletter Sign-Up & Bonus
Have you enjoyed our content?
Then subscribe to our newsletter and you'll be emailed more great content from Dividend Growth Investing & Retirement (DGI&R).
BONUS: Subscribe today and you'll be emailed the most recent version of the Canadian Dividend All-Star List (CDASL).
The CDASL is an excel spreadsheet with an abundance of useful dividend screening information on Canadian companies that have increased their dividend for five or more years in a row.
The CDASL is one of the most popular resources that DGI&R offers so don't miss out!


That’s a great introduction to the value line tear sheets. I also like to use their screens because they often find good candidates in areas I may not be looking.
Do you ever worry that your valuations might so low that the compounding you would have made by buying at fair value will outweigh the gains you will get by waiting for the bargain price? For example KO is a great company at a fair price, I don’t know if you’ll ever see it get down to the type of bargain discount you seem to look for anytime soon, or even in our lifetimes.
You’ve hit the nail on the head. The fact of the matter is that I value myself out of great companies quite often, but so far I’m still able to buy a few times a year, which I’m OK with. I might loosen my target buy prices a bit in the future, but for now I’m OK building my cash balance. I used to worry about this quite a bit, but because I may buy a place soon I’m OK with the extra cash. I want to be able to put down 20%, so having cash for now is fine.
Does Value Line cover the majority of the Cdn dividend stocks?
No not really. They only track the big ones.
Value line is pricey as heck.
https://dividendgrowthinvestingandretirement.com/2018/09/get-free-online-access-value-line-investment-survey-canada-list-canadian-stocks-covered-value-line/