Dividend Growth Investing & Retirement is supported by its readers through donations and affiliate links. If you purchase through a link on my site, I may earn a commission. Thanks! Learn more.
Two of the blogs I follow (Dividend Growth Investor and Dividend Mantra) recently announced that they bought shares of Target Corporation. I have a similar strategy to these other bloggers, so I thought I should check Target Corporation out too. Target Corporation has been having difficulty with its Canadian expansion plans and they recently announced higher than expected costs. They are also trying to recover from a data breach. Not surprisingly this has caused the share price to drop recently. In cases like these it can be an opportunity to buy quality companies at discounted prices. The trick is to identify if the share price drop is related to short term news, or because of a fundamental shift in the company or industry. I think in the long term Target Corporation will be able to rebound from these events, which is why I thought now would be a good time for a dividend stock analysis and to determine the price I’d be willing to buy at.
Company information
Target Corporation is a general merchandis
Sourced from Yahoo Finance
Target Corporation operates general merchandise stores in the United States. The company distributes its merchandise through a network of distribution centers, as well as third parties and direct shipping from vendors. Further, it provides general merchandise through its Website, Target.com; and branded proprietary Target Debit Card. As of January 17, 2014, the company had 1,921 stores, including 1,797 stores in the United States and 124 stores in Canada. Target Corporation was founded in 1902 and is headquartered in Minneapolis, Minnesota.
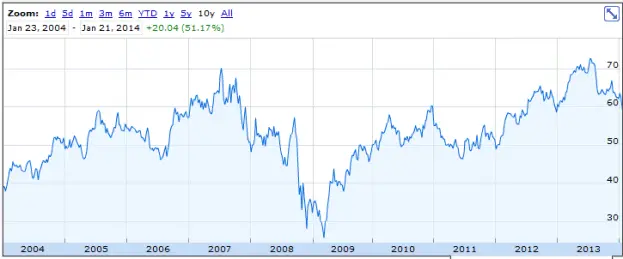
10 Year Stock Chart
Returns over the last decade have been OK, but not great. The 10 year annual average return is 4.2%. If we include the dividend payments over the past 10 fiscal years (Total dividends paid of $5.32) then the total average annual return would be 5.1% with the average return from dividends representing 0.9%.
Revenue and Earnings
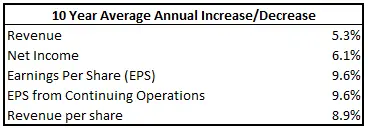
I get the following growth rates based on the most recent fiscal period end January 1, 2013.
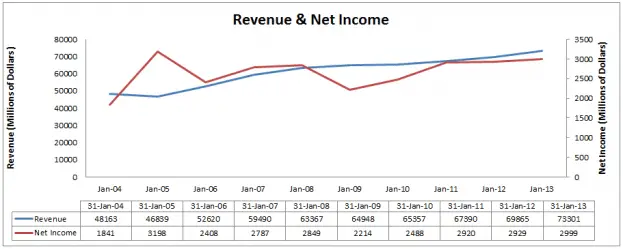
On a per share basis the growth rates are above the 8% I like to see. Revenue and Net income are below 8%, but they are still decent. If you look at the chart below you can see that revenue has been going up on a fairly consistent basis, but net income is a bit more erratic.
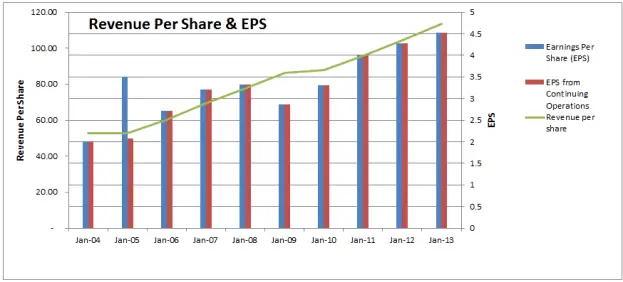
Revenue and EPS share have been going up almost like clockwork. This is always nice to see. As of January 21, 2014, the average analyst EPS estimate is $3.60 for the January 31, 2014 year end. This is quite a bit lower than last year, so while this chart looks great, it won’t look as nice in a few months when the annual results are announced. Sometimes these blip years are good opportunity to buy quality companies at discounted prices. The trick is being able to identify if this is the start of a negative trend or a one-time blip on the radar.
Dividends
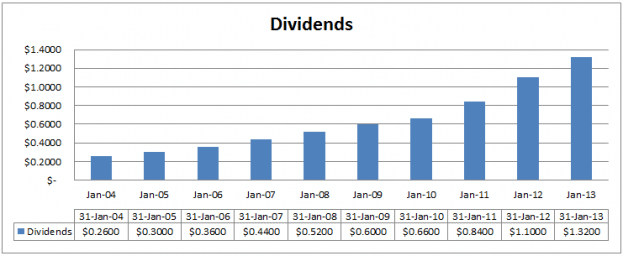
Target Corporation is a dividend champion having increased their dividend for 46 consecutive years in a row. Their most recent increase was recorded in August 2013 when they increased the quarterly dividend by 19.4% from $0.3600 to $0.4300.
As a dividend growth investor I’m always happy when I see a dividend chart like the one above. The dividend growth rates have been great over the past decade with the increases usually averaging around 20%.
Dividend Sustainability
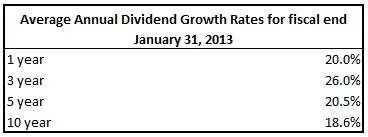
The stellar divided growth has come at the expense of a rising payout ratio. You can see from the table below that dividend growth has been about double that of EPS growth.
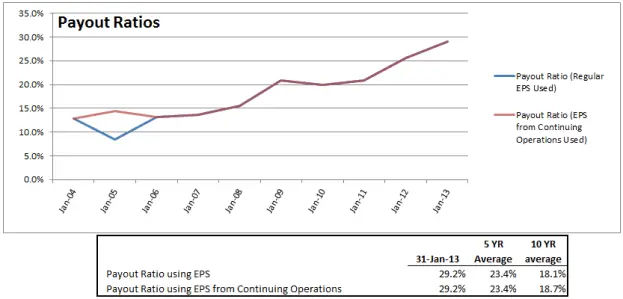
A dividend growth rate that is double EPS growth is not a sustainable long term trend. This is usually only achieved if the company has a low payout ratio, which Target Corporation does. Looking at the chart below you can see that Target Corporation doubled its payout ratio, from around 13% in 2004 to around 30% in 2013.
While Target Corporation’s payout ratio has been increasing, it is still at a reasonable level. I think dividend growth in the future will be more tied to earnings growth, but a payout ratio of around 30% still allows for some dividend growth beyond earnings growth.
Estimated Future Dividend Growth
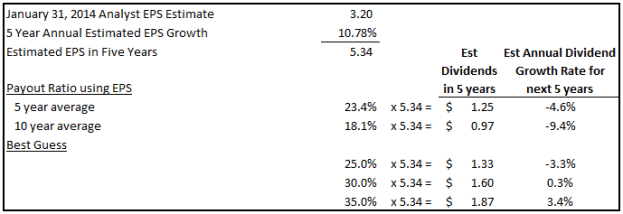
The average EPS estimate for the January 31, 2014 year is $3.20 and they are estimating EPS growth of 10.78%. Target Corporation recorded dividends of $1.58 ($0.36+$0.36+$0.43+$0.43) in the January 31, 2014 fiscal year. Using these figures and assuming a payout ratio of around 30% would result in roughly no dividend growth. As Target Corporation has been increasing its dividend at closer to 20% per year, I don’t think this is a realistic target.
I did some more research and discovered that one of Target Corporation’s goals is to have EPS of $8.00 in 2017. This is fairly ambitious, and the analysts over at Morningstar agreed. They thought Target Corporation wouldn’t be able to get $8.00 EPS until 2018. This just so happens to be five years out. I ran the numbers again using $8.00 EPS instead and these were the results.
I think this is a better estimate for dividend growth over the next 5 years. If we assume that they try and keep the payout ratio around 30% then this would result in dividend growth of 8.7%. Overall I’d expect dividend growth of around 8-10% going forward. They are currently having difficulties with the Canadian expansion and the recent data breach, so dividend growth in the next year or two could be below these levels, with improved dividend growth after these short term issues are resolved.
Related article: Can Past Dividend Growth Rates Be Relied Upon To Predict Future Rates?
Competitive Advantage & Return on Equity (ROE)
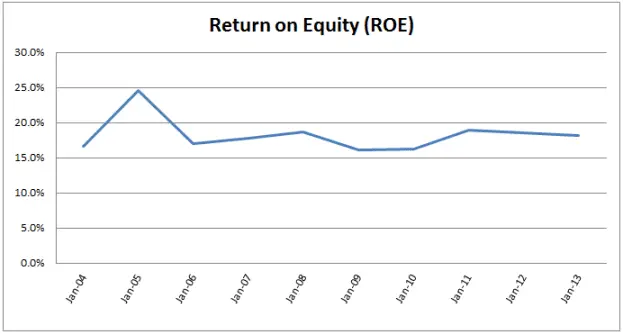
Target Corporation’s ROE has fluctuated a bit, but for the most part it has been around 15-20%, which is good. This coupled with the fact that it has increased its dividend for 46 years in a row would suggest some sort of competitive advantage. While this might have been true in the past, I’m not sure that it will be true in the future.
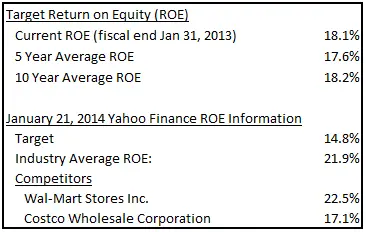
The industry is getting increasingly competitive and having Wal-Mart as one of your competitors is never fun. If you look at Target Corporation’s ROE compared to the industry and to Wal-Mart and Costco, you’ll notice that its ROE is below their levels. Target Corporation still has a decent ROE, but overall I wouldn’t say that Target Corporation has a wide moat. Morningstar rates Target Corporation as having no moat, Wal-Mart as having a wide moat, and Costco as having a narrow moat.
I still think Target Corporation is a good company and I’d consider investing in it, but if you want a wide moat company in the industry then I’d look at Wal-Mart.
Related Article: Wide Moat Stocks In The US Dividend Champions List
Debt & Liquidity
The debt to equity ratio is over 1.0, but this is roughly in-line with historic trends, so I’m not too worried. The quick ratio has dropped significantly, which is a bit disconcerting.
The quick ratio is low, but ultimately I don’t think Target Corporation is going under. I plan to monitor it and hopefully it starts to improve.
Shares Outstanding
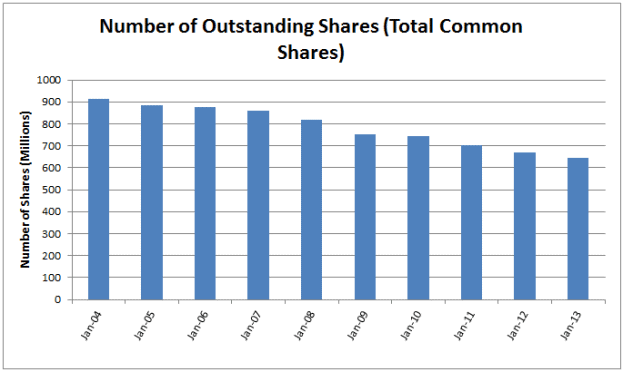
The shares outstanding have been decreasing at regular intervals which is nice to see. Hopefully this trend continues, but to be honest I’m more interested in increasing the dividend versus share buybacks. That said good companies will do both.
Valuation
You can see from the table below that Target Corporation appeared reasonably cheap when looking at a variety of value metrics for the year end January 31, 2013.
* The discount or premium to Graham Price hasn’t been calculated in the normal fashion. For the details read this article.
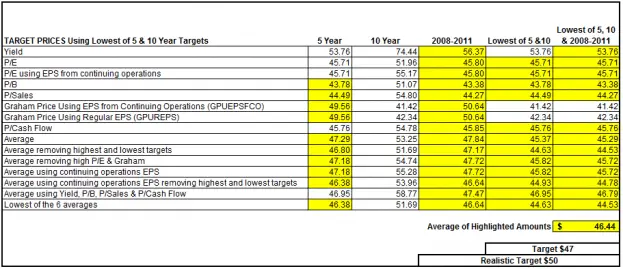
I use the averages from the above table to determine my target price. Using these averages creates a lot of different target prices, so I back-test this strategy over the past 10 years. I identify which of the 8 valuation techniques would have given me a chance to buy the stock in two to three fiscal years in the past 10 fiscal years. It’s not always possible to test my strategy back 10 years, due to limited financial information, but I do my best. The results are highlighted below.
The average of the highlighted amount gives me a target price of $47. Morningstar has a fair value of $64 and their 5 star price is $44.80. My target buy price is close to their five star price which makes me think it doesn’t need much adjusting. A $47 price works out to a forward dividend yield of 3.66%, which is above any of the highest yields over the past decade. This makes me think that my target might be too low, so I increased it a bit to $50. If Target Corporation had a wide moat then I’d consider a higher target buy price, but because they don’t I like a larger margin of safety. If this was Walmart, I’d consider a higher target buy price.
Below is a chart of the trailing twelve month (TTM) yield for Target Corporation for the past 5 years.
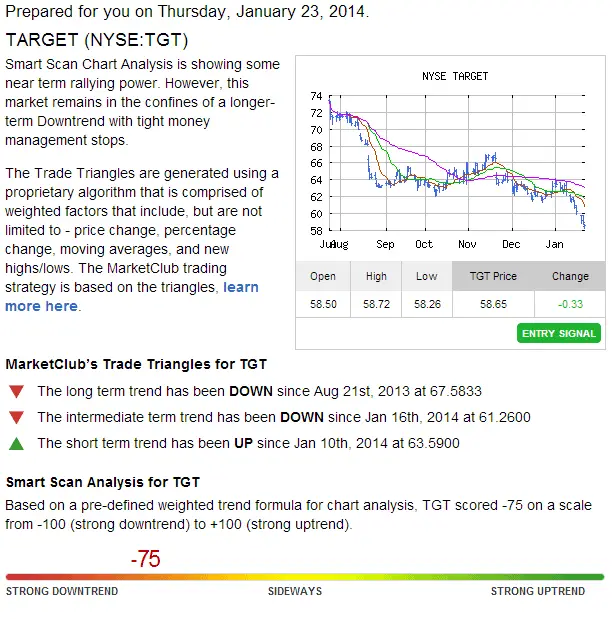
You can see from the chart that the yield is currently quite high compared to previous years. This can signal a good buying opportunity, but I plan on waiting for the price to drop to $50 before I’d consider buying. At $50 the forward yield would be 3.44% and the TTM yield would be 3.16%. I had a look at the trend analysis for Target Corporation and it appears to be in a strong down-trend, so it might get to $50.
To see the most recent trend analysis for Target Corporation or to sign up for free trend analysis’s click here. INO also has a list of the top 50 trending stocks and free trading seminars and videos.
Other Investment Options in the Same Industry
Some other investments to consider in the industry are Walmart and Costco.
Costco has a dividend streak of 10 years which pales in comparison to Target Corporation’s 46 years. Also Costco’s dividend yield is quite low and below the 2.5% minimum I typically target. Wal-mart on the other hand has a comparable dividend streak and while the yield isn’t quite as high as Target Corporation’s it is in the same ball park. Wal-mart has similar dividend growth rates, similar estimated future growth and a lower payout ratio. I completed a dividend stock analysis of Wal-mart in the past and I think Wal-mart will have stronger dividend growth in the near term. Also Wal-mart has a strong competitive advantage and wide moat, whereas Target Corporation while a competitive company probably doesn’t have a wide moat. If both companies were below my target buy price I’d go with Wal-mart, but Target Corporation is still a good dividend growth stock.
The US market saw some impressive gains in 2013, so I’ve found it difficult to identify cheap prices among US equities. You can see from the table below that all three options are still above levels that I’d consider buying at.
In my dividend stock analysis of Walmart I came up with a target buy price of $64, so both Target Corporation and Walmart would have to drop about 20% before I’d consider investing. With the recent negative news affecting Target Corporation’s price and the down trend I think it is more likely I’ll be able to buy Target Corporation . I had a look at Walmart’s trend analysis and it is in a down trend too, but it doesn’t have a data breach and higher than expected costs looming over its head.
Conclusion
With the recent negative news surrounding Target Corporation it could soon be a good opportunity to scoop some shares up. While I don’t think Target Corporation has a wide moat, they have been able to increase their dividend for 46 years in a row which signals a strong management team. On top of that I think they will continue their dividend streak with decent dividend growth for years to come. If Target Corporation drops below my target buy price of $50, I’d consider buying shares in this dividend champion.
Readers, what are your thoughts? Are you tempted to buy now, or would you wait?
Photo credit: Vargklo / Foter.com / Public domain
Newsletter Sign-Up & Bonus

Have you enjoyed our content?
Then subscribe to our newsletter and you'll be emailed more great content from Dividend Growth Investing & Retirement (DGI&R).
BONUS: Subscribe today and you'll be emailed the most recent version of the Canadian Dividend All-Star List (CDASL).
The CDASL is an excel spreadsheet with an abundance of useful dividend screening information on Canadian companies that have increased their dividend for five or more years in a row.
The CDASL is one of the most popular resources that DGI&R offers so don't miss out!











Hi DGIR;
I was recently in a local Target store. I would be reticient about buying in right now until the Canadian expansion plays out in the stock report. Talking with one of the cashiers, they told me that their hours had been cut and there was not that much in sales (hence the hrs cut)
Aside form getting 90% off on some Christmas items I wonder if Target will do all that well in the Great White North. After all, between them and Wally, how low can you go.
I’d hold off a while to le thedust settle unless there is a big pull back. Also we need to take into account that we will pay a premium price for US stocks with the exchange rate. If the C$ keeps going down then you can make money just on the exchange rate. If the C$ rises then it is that much more that the stock needs to appreciate to compansate for the $ rise.
It’s a fair concern, but if you wait until everything is operating perfectly then there is a good chance the price will be higher. My target buy prices are pretty conservative, and this usually means there is some news that has caused the price to drop. In these cases if I think they are short term events that don’t change the fundamentals of the business I will buy shares. It’s this strategy that allows me to buy great companies at discounted prices.
Greettings, DGI&R,
Your Dividend Stock Analysis of Target Corporation is the first of your analyses that I’ve read — I now look forward to reading many more! The thorough detail and clear explanation of the “whys and wherefores” of the data you provided in your Target Corp. analysis is peerless. I especially appreciated your inclusion of the link providing information and a clear understanding of your valuation method and how you determine target prices in general (i.e., not just for TGT). Many thanks for sharing your thoughts and insights — my small donation serves only as a tokem of a much greater appreciation.
Sincerely,
Richard
Thank you so much for the donation Richard!
DGI&R
Hi. I’m a Spanish long term investor, and I wonder what are the diferences between Wal-Mart and Target, in terms of customer attention, price, quality… basically, in which of both can you see more people buying. You go to that supermarkets every day/week, so you know better than me that details that differenciate the BIG companies from the good ones.
New in this field of investing. Tyvm/ very helpful!