Dividend Growth Investing & Retirement is supported by its readers through donations and affiliate links. If you purchase through a link on my site, I may earn a commission. Thanks! Learn more.
“Dividend Yield + Dividend Growth = Prospective Return”
Josh Peters, The Ultimate Dividend Playbook (AL), Chapter 2
⭐ Find dividend growth stocks that have survived multiple recessions and increased dividends for 5, 10, 25+ years in a row.
This formula is based on the Gordon Growth Model and is used to estimate the total return of a stock. It looks simple, but the Dividend Growth part of this formula can be tricky as it involves guessing a reasonable future dividend growth rate.
Fortunately, Josh Peters, CFA, a respected dividend growth investor, author of the popular book “The Ultimate Dividend Playbook”, and former editor of the Morningstar DividendInvestor newsletter, created the Dividend Drill Return Model (DDRM) to help with this process.
Learn by example as I use the DDRM to estimate future dividend growth and total returns for Bank of Nova Scotia (TSE:BNS). Once I’ve explained how the DDRM works I’ll share the Bank of Nova Scotia DDRM spreadsheet I used.
The Dividend Drill Return Model (DDRM)
To use the DDRM you’ll need 6 pieces of information (six inputs):
- Stock/share price
- Dividend rate
- Earnings per share (EPS)
- Return on equity (ROE)
- Core growth estimate
- Free growth estimate
The first three (Price, dividend, and EPS) are easy enough to figure out, but the last three (ROE, core growth, and free growth) are long-term future estimates which make them a bit harder.
First, let’s look at Bank of Nova Scotia as an example and then I’ll go deeper into the six inputs and the various elements of the DDRM.
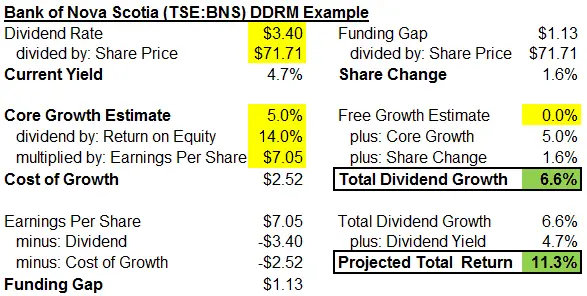
Inserting the 6 inputs for Bank of Nova Scotia (highlighted in yellow below) into the DDRM below will give an estimate of dividend growth and total return (highlighted in green below).
Stock/share price, Dividend rate, and EPS
As of October 14, 2018, Bank of Nova Scotia’s share price was $71.71.
Bank of Nova Scotia pays a quarterly dividend of $0.85, so the annual dividend rate is $3.40 ($0.85 x 4).
EPS should be a forward estimate. I’ve used Value Line’s Bank of Nova Scotia 2018 EPS estimate of $7.05.
Return on equity (ROE) estimate
If you are investing in companies with sustainable competitive advantages (economic moats) then past ROE can be helpful in estimating the projected return on equity.
“I usually wind up using either the most recent year’s ROE or, if ROE has fluctuated widely in the past, a 5 or 10-year average.”
Josh Peters, The Ultimate Dividend Playbook (AL), Chapter 7
That said, if the current or historical ROE is more than 25% to 30% then consider using a lower ROE as it is unrealistic for a company to maintain such a high ROE in the very long-term.
Another factor to consider is moat deterioration. If the moat is deteriorating, then you’ll need to make an adjustment to lower the projected future ROE.
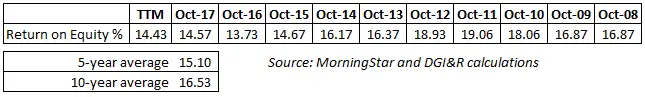
For Bank of Nova Scotia, I decided on a projected ROE of 14%. In 2018 Q3, Bank of Nova Scotia’s ROE was 14.5% and their medium term financial objectives include a 14%+ ROE.
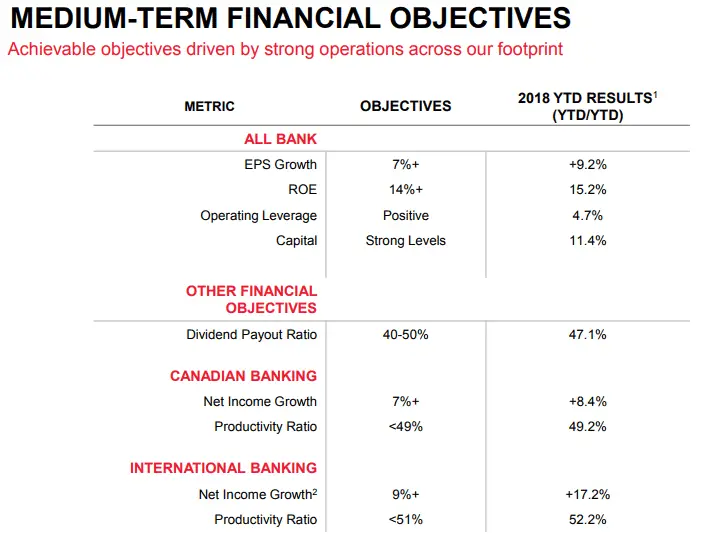
Source: Bank of Nova Scotia Investor Presentation Third Quarter 2018
Looking back over the past decade a 14% ROE looks reasonable if not a little conservative with 5 and 10-year averages of 15.1% and 16.5%.
 Core growth estimate
Core growth is the hardest to estimate, but Mr. Peters recommends starting with a building blocks approach with broader trends and being conservative as this estimate can have a large impact in the DDRM.
“I try to tie my expectations to broader trends – the growth of the U.S. population, inflation, regional economic growth, and so forth – whatever might be influencing the expansion potential for the business at hand.”
Josh Peters, The Ultimate Dividend Playbook (AL), Chapter 7
For Bank of Nova Scotia, I came up with a core growth estimate of 5.0%.
Canadian and US future economic growth is estimated to be around 1.5% to 2.5% [Future real gross domestic product (GDP) growth. Sources: Knoema (Canada) & Knoema (US)].
Add in 2% inflation and we are up to 3.5% to 4.5%.
And finally, I decided to bump it up to 5.0% because Bank of Nova Scotia has material operations in higher growth Pacific Alliance countries like Mexico, Peru, Chile, and Colombia.

Source: Bank of Nova Scotia Investor Presentation Third Quarter 2018
The 5% core growth estimate also happens to match Value Line’s 3-5 year loans growth estimate.
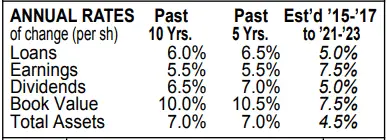
Source: August 10, 2018 Bank of Nova Scotia Value Line report
Note that Value Line only gives 3-5 year estimates and for our core growth estimate we want to think longer term than this. If you thought growth was going to drop off after 5 years then this 5% wouldn’t be a good estimate and would need to be lowered.
Related article: How to get free online access to the Value Line Investment Survey in Canada [+ list of Canadian stocks covered by Value Line]
Free growth estimate
Free growth is earnings growth that doesn’t require reinvestment. This is pretty rare, so in most cases, this will be left at 0%. The example given in the book is a property-owning REIT that has contractual rent increases leading to 2% annual earnings gains without additional capital investment.
For Bank of Nova Scotia, I left the free growth estimate at 0.0%.
Elements of the DDRM
Now that we’ve gone over the six inputs let’s look at some of the elements of the DDRM (In red and black boxes below).

Cost of growth
The cost of growth calculation is an estimate of how much the company has to spend on a per share basis in order to continue to grow.
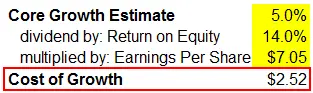
In Bank of Nova Scotia’s case, roughly 36% (2.52 / 7.05) of EPS is needed to fund growth.
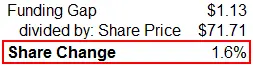
Funding gap
The funding gap calculation shows the amount of money left over after growth and the dividend are paid for.
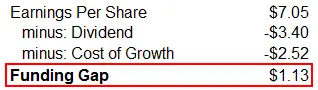 It can be a positive or negative number. If the funding gap is positive then there is money left over that could be used to buy back shares. If it is negative then it implies that the company will have to issue more shares to fund growth.
Share change
The share change calculation shows how much of an impact the funding gap is going to have on dividend growth.
 Dividend growth
The share change is added to the free and core growth estimates to estimate future dividend growth.
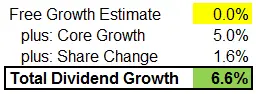
Using our six inputs has resulted in a future dividend growth estimate of 6.6% for Bank of Nova Scotia.
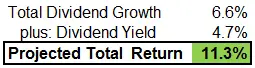
Total return
Going back to the equation “Dividend Yield + Dividend Growth = Prospective Return”, we can see that the total return estimate for Bank of Nova Scotia is 11.3%.
 And that’s how the DDRM works!
Excel DDRM Spreadsheet
I’ve included my DDRM spreadsheet for download here: Dividend Drill Return Model (DDRM).
I left the Bank of Nova Scotia figures used in this article in the spreadsheet, so just remember to adjust the inputs to the company you are assessing.
DDRM Limitations
Now that you understand how the DDRM works, let’s talk about some of its limitations.
The first limitation is that the DDRM is based on the Gordon Growth Model.
“The Gordon Growth Model doesn’t work particularly well for companies with low dividend yields (less than 2 percent), high dividend growth rates (greater than 7 percent), or firms with a wide range of potential growth rates. But for mature businesses with safe, decent yields and predictable growth, this formula can work very well indeed.”
Josh Peters, The Ultimate Dividend Playbook (AL), Chapter 8
The second limitation is its reliance on high-quality estimates. Four of the six inputs (EPS, ROE, core growth, and free growth) are estimates. Make a mistake here and you could end up with unreasonable dividend growth and total return expectations.
The third limitation is that the “dividend yield + dividend growth = total returns” formula assumes that a single reasonable dividend growth rate is used in perpetuity.
“To work, one must presume that the current dividend is sound and the dividend growth rate will remain stable into the indefinite future. However, if the stock price rises at roughly the rate of the dividend over time, we can use this approach to forecast total returns over time horizons shorter than forever. I generally use a five-year view.”
Josh Peters, The Ultimate Dividend Playbook (AL), Chapter 7
This requirement to find a single dividend growth rate suitable for a 5-year or more period is also why the DDRM is …
“not particularly well suited to deeply cyclical firms, whose earnings power and even dividend rates will vary widely from year to year. It’s also not suited for emerging-growth stories. But for the ranks of relatively consistent, mature, moat-protected stocks […] we can use the dividend as a critical selection tool.”
Source: Morningstar Investing Classroom – The Dividend Drill (If you want to learn a bit more about the DDRM, this link is worth checking out.)
How to mitigate DDRM limitations
For the first and third limitations, it comes down to awareness. So long as you are aware that the DDRM won’t be as reliable for stocks with volatile earnings, yields under 2% or dividend growth rates above 7% and you avoid or limit your use of the DDRM in these scenarios, you should be OK.
The second limitation is harder to mitigate as no one can predict the future.
Estimates will always be flawed, but by running the DDRM for multiple scenarios you can at least get a better overall picture with a range of expectations.
I ran the DDRM again using core growth and ROE estimates that were plus or minus 2% of my original 5% core growth and 14% ROE estimates. Depending on how reliable you think your estimates are you would adjust the +/- 2% up or down. The less reliable your estimates the wider range of expectations you should have.

In our example, we are left with a dividend growth range of 5.6% to 7.8% and total returns ranging from 10.4% to 12.5% for Bank of Nova Scotia.
While the DDRM has its limitations, I still think it can be a useful tool for assessing higher yield, high quality, relatively consistent, and mature dividend growth stocks.
It also works well as a comparison tool when trying to figure out which of two or more stocks you want to invest in.
Observation: Quality matters
High-quality companies that have sustainable competitive advantages usually have higher ROEs. We learned from our DDRM Bank of Nova Scotia example that a higher ROE translates into higher dividend growth and total returns. This is just another reason why it is important to focus on quality companies when investing for the long-term.
“All else being equal, a corporation with a high ROE is going to do a better job of increasing its dividend than one with a low ROE, so evaluating and monitoring a company’s competitive position (economic moat) is essential.”
Josh Peters, The Ultimate Dividend Playbook (AL), Chapter 3
Summary
“Dividend Yield + Dividend Growth = Prospective Return”
Josh Peters, The Ultimate Dividend Playbook (AL)
While this formula looks simple the Dividend Growth part can be tricky. Guessing a reasonable future dividend growth rate is hard, but the Dividend Drill Return Model (DDRM) can help with this process.
With six inputs (Price, dividend, EPS, ROE, core growth, and free growth) you can use the DDRM to estimate dividend growth and total returns.
We estimated dividend growth of 6.6% and total returns of 11.3% with our Bank of Nova Scotia example.
Because of its reliance on estimates, it is recommended to run the DDRM for multiple scenarios to get a better overall picture with a range of expectations. For Bank of Nova Scotia we came up with a dividend growth range of 5.6% to 7.8% and total returns ranging from 10.4% to 12.5%.
Having a range of estimates is better, but there are still some DDRM limitations. This is why it is better to limit your use of this tool to assessing higher yield, high quality, relatively consistent, and mature dividend growth stocks.
No one can predict the future, so it is important to take these DDRM estimates exactly as they are, as ESTIMATES. While estimates may not accurately predict the future, they can help with decision making and creating a framework to help pick investments that meet your needs.
I see the DDRM as a useful tool when comparing multiple dividend growth stocks in order to determine which one is best suited to your needs.
Despite its limitations, “for mature businesses with safe, decent yields and predictable growth, this formula can work very well indeed.” – Josh Peters
Disclosure: I own shares of Bank of Nova Scotia. You can see my portfolio here.
Newsletter Sign-Up & Bonus
Have you enjoyed our content?
Then subscribe to our newsletter and you'll be emailed more great content from Dividend Growth Investing & Retirement (DGI&R).
BONUS: Subscribe today and you'll be emailed the most recent version of the Canadian Dividend All-Star List (CDASL).
The CDASL is an excel spreadsheet with an abundance of useful dividend screening information on Canadian companies that have increased their dividend for five or more years in a row.
The CDASL is one of the most popular resources that DGI&R offers so don't miss out!


Thanks for sharing. This is a more detailed approach than the Chowder Rule which takes dividend yield + dividend growth average over 5 years. With a gradient comparison eg 8 for utilities and 14 for other high yield stocks gives a predictor. Some like a credit rating of A to go with it as well as what world trends
are indicating.
Yeah I like the chowder rule as a quick way to see if an investment meets my needs. Instead of using the past 5 years dividend growth rate I sometimes just plug in Value Line’s future dividend growth estimate.
All very interesting, but based on too many guesstimates, hence unreliable … and overly complex.
There are two components of total return: (1) the future stock price and (2) the future dividend stream.
(1) No one can predict with any degree of certainty which stock will increase in price. We can examine metrics to get a better sense of whether the company is a solid one, but stocks of solid companies sometimes decline. The Market is not always rational, at least in the short and medium terms.
(2) For the dividend-growth part of the total return equation, linking metrics like ROE to an estimate of future dividend growth is questionable. Even if ROE is sky high, management may prefer to issue a small dividend and use the extra cash for development, or share buy-backs, etc.
Better (and more dependable) is to use past dividend growth, discard any outlier dividends such as abnormally-high dividends in a certain year due to (for example) tax reform, then calculate the future value of the current dividend using the guesstimated dividend CAGR. Excel makes this easy.
This will tell the investor whether the stock is a good dividend-growth candidate, but thinking that an investor can project not only the dividend but the stock price as well is a stretch.
“(1) No one can predict with any degree of certainty which stock will increase in price.“
Too true!
Past dividend growth can be somewhat predictive for the types of dividend growth stocks we invest in, unless the prior growth rates are high (>8%), in which case future dividend growth is typically less than prior years. I think looking at a companies dividend history is important too, but I still think it’s important to look to the future.
What I liked about the DDRM is that it forces you to think about the future and come up with expectations for your investment. The inherent problem with an estimate is that it’s an estimate and no one can predict the future, but it still has value in the sense that it helps you create a framework for decision making to determine if the investment meets your needs.
I think you are probably right about the complexity of it being an issue for the average investor. A lot of time I’ll look at Value Line’s dividend growth estimate and just plug that into the simpler formula: Yield + Dividend Growth, but value Line doesn’t cover all stocks so I wanted to share another method to come up with dividend growth estimates.
DGI&R
I think based on the comments I should do another article on other methods of estimating dividend growth.
Hi DGIR,
I do like parts of this model, mostly how it challenges you to look to the future and try to evaluate how a company will perform.
Too often we look to what has happened in the past and stop there.
Oddly enough, these projections use the past to build a base for future earnings, dividend, etc….meaning the past had laid a foundation for what the future holds.