Dividend Growth Investing & Retirement is supported by its readers through donations and affiliate links. If you purchase through a link on my site, I may earn a commission. Thanks! Learn more.
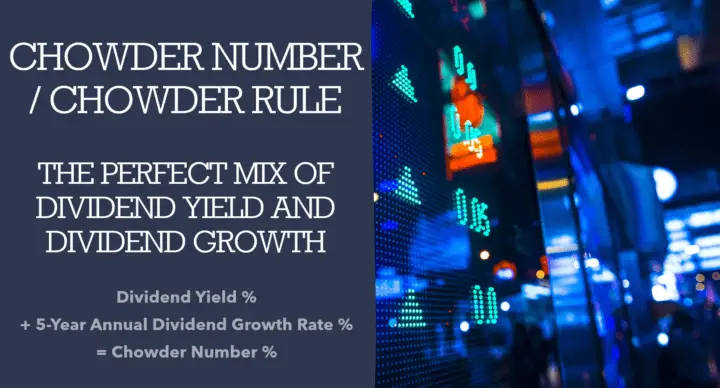
The Chowder Number/ Chowder Rule is all about finding the right mix between dividend yield and dividend growth.
In a perfect world, we’d all be investing in high-yield, high-dividend growth stocks. The reality is that many high-yield stocks have lower dividend growth rates than lower-yielding stocks.
⭐ Find dividend growth stocks that have survived multiple recessions and increased dividends for 5, 10, 25+ years in a row.
So how do you find the right balance between dividend yield and dividend growth?
Enter the Chowder Number / Chowder Rule …
What is the Chowder Number / Chowder Rule?
If the dividend yield is low you want a higher dividend growth rate, and if the yield is high you’d be willing to accept a more moderate dividend growth rate.
The Chowder Number / Chowder Rule applies this premise using a simple formula:
And, the Chowder Rules set out reasonable criteria of how to best balance dividend yield vs. dividend growth.
Sure Dividend does a good job explaining the rules:
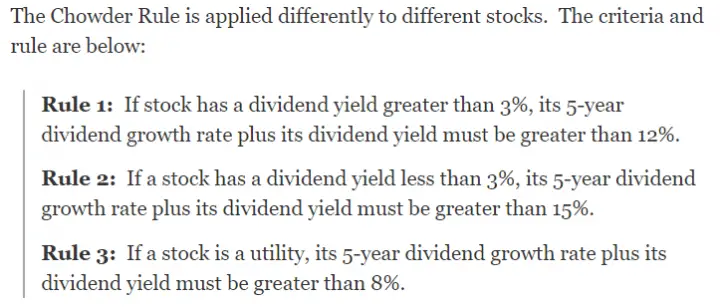
Source: https://www.suredividend.com/the-chowder-rule-explained/
The threshold for utilities is lower because utilities are thought to have more reliable/predictable income streams.
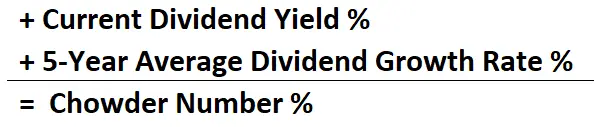
How to Calculate the Chowder Rule / Chowder Number?
Current Dividend Yield % + 5-Year Average Dividend Growth Rate % = Chowder Number %
The Chowder Rule is normally a backwards-looking measure as it uses the historic 5-year dividend growth rate + current dividend yield.
Fortis Inc (TSE:FTS) Example
I’ll use the utility, Fortis Inc (TSE:FTS) as an example.

As I write this in February 2021, Fortis has a 3.9% dividend yield and its 5-year annual dividend growth rate was 6.8%.
So the Chowder Number would be 10.7%.
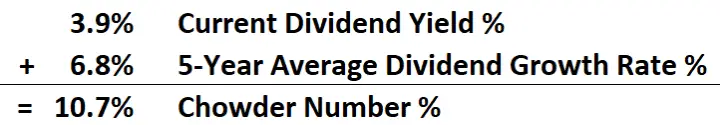
Fortis is a utility, so it passes the Chowder Rule as its Chowder Number of 10.7% is higher than 8%.
If Fortis was not a utility it would fail the Chowder Rule because its yield is over 3%, but its Chowder Number is less than 12%.
If you have two stocks that both pass the Chowder Rule, the one with the higher Chowder Number is generally better.
In other words, the higher the Chowder Number the better.
The Chowder Number is a useful screening tool for dividend growth investors, but I prefer the Forward Chowder Number.
How to Calculate the Forward Chowder Number?
I like to use a forward-looking (future) dividend growth estimate instead of the backwards-looking 5-year dividend growth rate.
This helps weed out stocks that are slowing future dividend growth.
The difficulty with the Forward Chowder Number is that there are only a few places to find long-term dividend growth estimates.
For dividend growth estimates I generally look at 3 different sources:
- Value Line,
- Dividend Stocks Rock, and
- Company Guidance, if it’s available (often it’s not).
After reviewing these 3 resources, I use my own judgement to come up with a reasonable dividend growth estimate to use in the Forward Chowder Number calculation.
Fortis Inc Example Continued
Continuing with the Fortis Inc example, I can see that Value Line is estimating average annual dividend growth of 6% per year over the next 3-5 years.
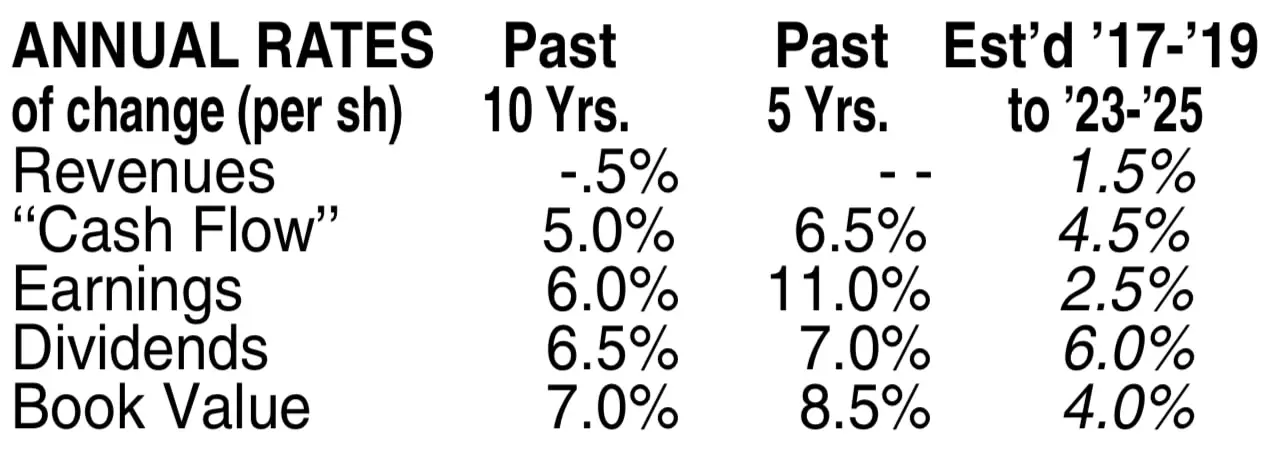
Source: December 11, 2020, Fortis Inc Value Line Report
Value Line only covers a limited number of Canadian stocks, so for better Canadian coverage, I recommend Dividend Stocks Rock.
Tip: Check your library’s online database section for free online access to Value Line. For a list of all Canadian libraries that provide free online access to Value Line read this article.
Dividend Stocks Rock (DSR) is estimating the same 6% dividend growth, but for 10 years, then dropping to 5.5% after that.
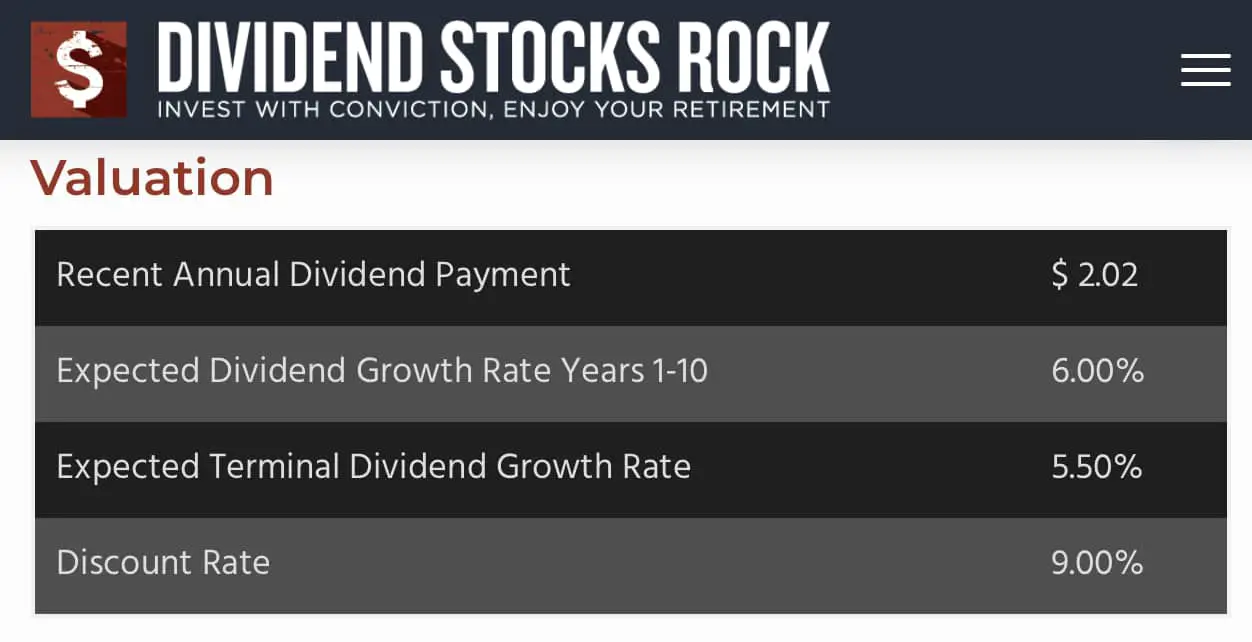
Source: Dividend Stocks Rock (DSR) Fortis Inc Stock Card – November 23, 2020
DSR also provides a short summary of the dividend growth prospects for each of the 500+ companies it covers. I like to check this at the same time as I get their 10-year dividend growth estimate.
Source: Dividend Stocks Rock (DSR) Fortis Inc Stock Card – November 23, 2020
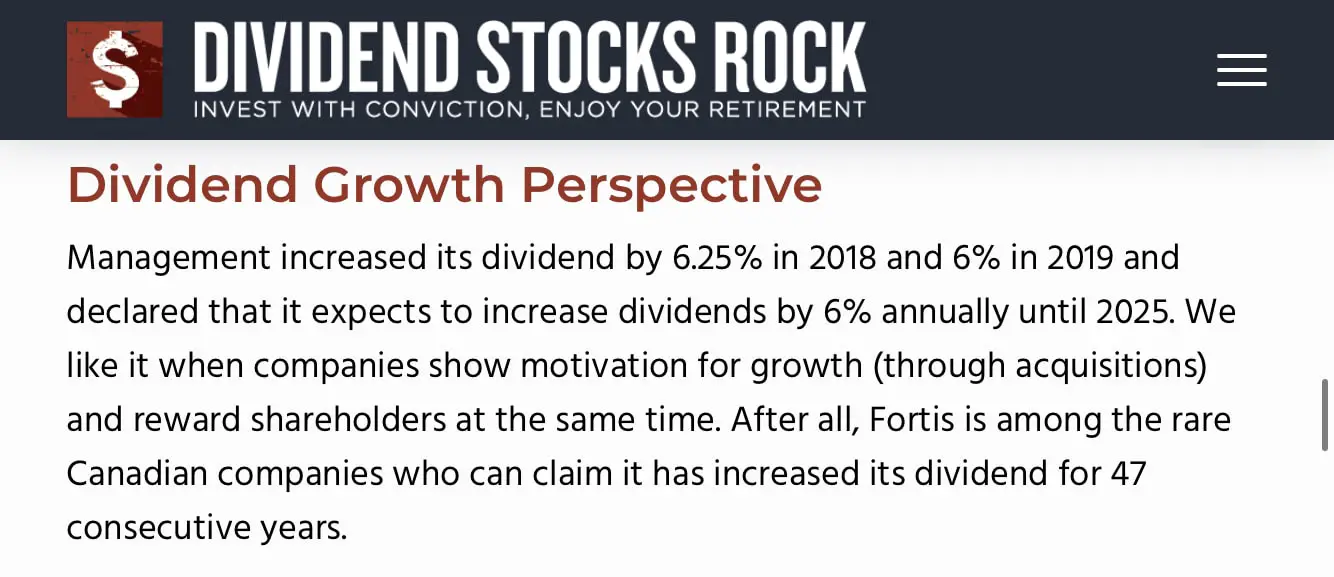
You’ll notice in this Fortis example DSR mentions that management already plans to increase dividends by 6% per year until 2025.
And that brings us to Fortis’s company guidance.
Just as DSR pointed out, Fortis is guiding 6% average annual dividend growth to 2025.
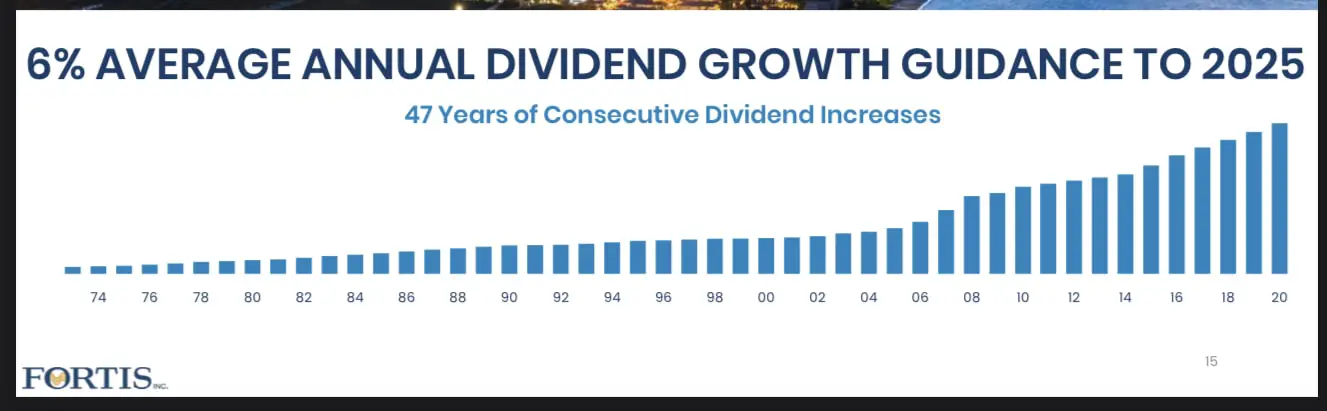
Source: Fortis Inc. February 2021 Investor Presentation
Tip: If you want start-to-finish instructions on exactly how I found these 3 dividend growth estimates watch the video below.
Video: Step-by-Step Instructions on Where to Find Long-Term Dividend Growth Estimates from Value Line, Dividend Stocks Rock & Company Guidance
So I have Value Line, DSR, and company guidance all giving me a 6% per year long-term average dividend growth estimate.
A quick look at its historic dividend growth rates and I can see they are also around 6%.
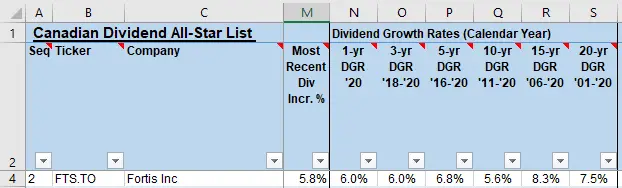
Source: Canadian Dividend All-Star List, February 16, 2021
So taking all that into consideration, I think it’s reasonable to use 6% as our future dividend growth estimate in our calculation of the Forward Chowder Number.
I should mention that normally it’s not this simple.
In our Fortis example, we got lucky and all 3 resources (Value Line, DSR, & company guidance) had the same 6% long-term dividend growth estimate. When the dividend growth estimates differ, you have to rely more on your own judgement.
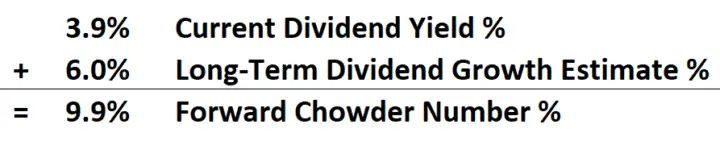
Adding our 6% long-term dividend growth estimate to Fortis’s dividend yield of 3.9% results in a Forward Chowder Number of 9.9%.
Here’s a reminder of the 3 Chowder Rules.
- If the yield is +3%, the Chowder Number should be above 12%,
- If the yield is less than 3%, the Chowder Number should be above 15%, and
- If the company is a utility, the Chowder Number should be above 8%.
Fortis is a utility, so rule #3 from above applies.
Fortis passes the Chowder Rule as its Forward Chowder Number of 9.9% is higher than 8%.
Summary
How do you find the right mix between dividend yield and dividend growth?
If the dividend yield is low you want a higher dividend growth rate. If the yield is high you’d be willing to accept a slightly lower dividend growth rate, but what’s a good mix?
The Chowder Rule / Chowder Number helps solve this problem with a simple formula to find a good balance between dividend yield and dividend growth.
Dividend Yield % + 5-Year Annual Dividend Growth Rate % = Chowder Number %
- If the yield is +3%, try for a Chowder Number above 12%,
- If the yield is less than 3%, try for a Chowder Number above 15%, and
- If the company is a utility, try for a Chowder Number above 8%.
The higher the number the better.
The Chowder Number is a useful screening tool for dividend growth investors, but I prefer the Forward Chowder Number.
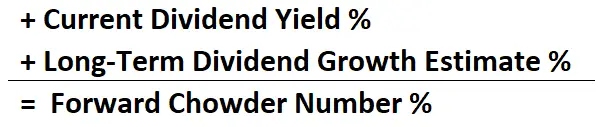
Current Dividend Yield % + Long-Term Dividend Growth Estimate % = Forward Chowder Number %
I like to use future or forward-looking dividend growth estimates instead of the backwards-looking 5-year dividend growth rate to avoid stocks with slowing dividend growth.
To find long-term dividend growth estimates I use:
- Value Line,
- Dividend Stocks Rock, and
- Company Guidance, if it’s available (often it’s not).
Which do you prefer, the regular Chowder Number or the Forward Chowder Number?
Newsletter Sign-Up & Bonus
Have you enjoyed our content?
Then subscribe to our newsletter and you'll be emailed more great content from Dividend Growth Investing & Retirement (DGI&R).
BONUS: Subscribe today and you'll be emailed the most recent version of the Canadian Dividend All-Star List (CDASL).
The CDASL is an excel spreadsheet with an abundance of useful dividend screening information on Canadian companies that have increased their dividend for five or more years in a row.
The CDASL is one of the most popular resources that DGI&R offers so don't miss out!


Hi DGI&R – The additions you made to your new spreadsheet are great. I like your thoughts on the Forward Chowder Number. Will you be adding it to your spreadsheet – this would be excellent.
Thanks! Glad you like the upgrades. Because the Forward Chowder relies on dividend growth estimates and your own judgement I didn’t want to include it in the list. It’s a subjective number, so I’m wary of adding metrics to the list that are long term estimates.
Also using judgement to provide the Forward Chowder Number for 100+ stocks each month would be too time consuming to do it well.
What I’ll do sometimes is to use the regular Chowder Number in the Canadian Dividend All-Star List to screen the results down to a few I’m interested in and the go and figure out the Forward Chowder Number on the few interesting names.
Cheers,
DGI&R
The Chowder rules seems elegant in its simplicity, but does the math work? It may depend on your time howizon. Running some numbers on a financial site, I took the same Chowder number–12 and ran it two different ways. Once with an intial yield of 8% with 4% growth (compounded), then 4% yield with 8% growth. The higher initial yield is further ahead until the crossover approximately 27 years after purchase. That is a long time in the world of finance! That leads me to believe the Chowder rule could use with a little tweaking to work with a more realistic time horizon.
Is my math correct?
Hi Mike,
Interesting point you bring up here.
In your example you’ve got two stocks with exactly the same Chowder number, so as a tie-breaker I’d probably pick the one with a higher dividend yield, assuming the dividend appears safe. Most 8% yielding companies don’t have safe dividends, but it can happen. When you compare two stocks it’s more than just one metric you should use to compare them.
I think a better way to think about the Chowder Rule is as a Pass/Fail metric. You want at least a 12% Chowder number (assuming yield is >=3% and it is not a utility) so that you have a nice balance of yield and dividend growth. If it’s lower than this, focus on a different stock. If you have two companies that both pass the Chowder Rule, then you’ll be looking at more than just the Chowder Number to properly compare them and pick the investment that fits best with your objectives.
The comment you made about the time horizon is exactly correct. Someone might be planning to use dividend income to retire in 5, 10, 20, 30 years, etc. so their goals will be different. Or you have others that use the Forward Chowder Number not as a way to ensure a certain amount of dividend income in the future, but rather as a really rough estimate of total returns.
The Gordon Growth Model assumptions lead to long-term total return estimates being equal to the yield + the dividend growth of a stock, which is the same formula as the Forward Chowder Rule. So in this instance, they are using the metric for total return purposes versus someone else using it for ensuring X amount of dividends in the future.
I didn’t check your math, but I did use this Yield On Investment Calculator (https://tools.mhinvest.com/mhichart) to run your 8% yield + 4% dividend growth vs. 4% yield + 8% dividend growth scenario. I ran it without dividend reinvestment and the cross-over was between years 19 & 20. Here’s a screen shot:
When you run the same scenario with dividend reinvestment the 4% yield option never catches the 8% yield option, but this assumes you can continue to reinvest dividends at 8% yield and 4% dividend growth throughout the whole time horizon which is unlikely in reality. 8% yields aren’t typically safe and your odds of a dividend cut are higher. Here’s the screen shot of the scenario with dividend reinvestment:
Cheers,
DGI&R
Excellent info as always! Thank you
Thanks Chuck!
Firstly let me say “Thank You!” for all the effort you put into your site, and the generosity with which you share it. Secondly, another “thank you” for the rapid response.
Given the differences I had chosen in distribution timing and reinvestment, I’d suggest our numbers are comparable, and I agree with your comments.
Personally, I discount the dividend growth slightly when calculating my “Chowder score”. Not that my investing horizon is short, but I believe the mathematical implication of the Chowder formula is to put a little too much emphasis on growth given the variables in the business cycle. In the end; however, I would suggest that our lists would be very similar.
Cheers,
Hi DGI&R,
You may only hear it a couple thousand times… but your insight, knowledge, and information has proven so very valuable to those of us reaching to be make things ‘proper’. Our ‘proper’ is clearly a very subjective work in progress.
I will be adding two columns to my spreadsheet which lists my favourite stocks, namely: Past and Future Chowder %s.
Thank you very much for putting your knowledge out here for us. I can make all sorts of emotional mistakes so extra guiding principles are also good.
Your monthly email is the only one I enthusiastically await.
Do stay well,
Jeff
Thanks for those very kind words Jeff. Always nice to get positive feedback!
Cheers,
DGI&R
Excellent work. Yield histories are HARD to find (at least for Canadian securities) and your work is precisely what I’d been looking for many, many years. The timelines around the Chowder rule are, of course, hugely important.
John Grant