Dividend Growth Investing & Retirement is supported by its readers through donations and affiliate links. If you purchase through a link on my site, I may earn a commission. Thanks! Learn more.
“Dividend Yield + Dividend Growth = Prospective Return”
Josh Peters, The Ultimate Dividend Playbook
Yield + Dividend Growth = Total Return Estimate. Such a simple formula, but you’ll see from US and Canadian examples that it’s also been surprisingly accurate. That said, it has some pitfalls to be aware of too.
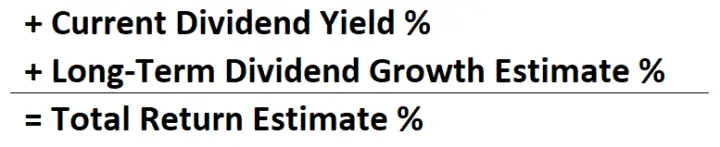
Yield + Dividend Growth Estimate = Total Return Estimate
I use this formula to give me a really rough estimate of total returns going forward.
⭐ Find dividend growth stocks that have survived multiple recessions and increased dividends for 5, 10, 25+ years in a row.
Rather than rely on it for an accurate total return I use it more as a weeding out process to avoid low total return stocks or to compare two investments I might be considering.
Fortis (TSE:FTS; NYSE:FTS) Example

Here’s an example of how you might use the formula to estimate future total returns.
Dividend Stocks Rock (DSR), Value Line, and Fortis company guidance are all estimating long-term dividend growth of 6%/year for the utility stock Fortis Inc.
Fortis also has a long history of dividend growth around the 6% mark with a similar payout ratio to what it has as I write this.
All said, I feel like 6% is a pretty reasonable long-term dividend growth estimate.
Now that we’ve got the hard part of the equation (the long-term dividend growth estimate) figured out, let’s add in the current dividend yield.
As I write this, the yield of Fortis Inc is 4.1% so putting it all together gives us an average annual total return estimate of 10.1% (4.1% + 6.0%).
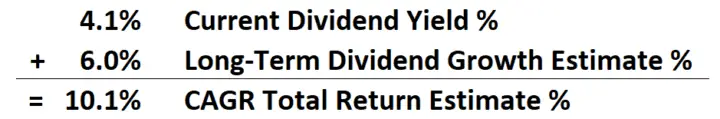
And that’s how you use this simple formula, Yield + Dividend Growth = Total Return, to estimate future average annual total returns.
Yield + Dividend Growth = Total Return Estimate Continued
My favourite investing book also uses a variation of this formula but adds in a quality element.
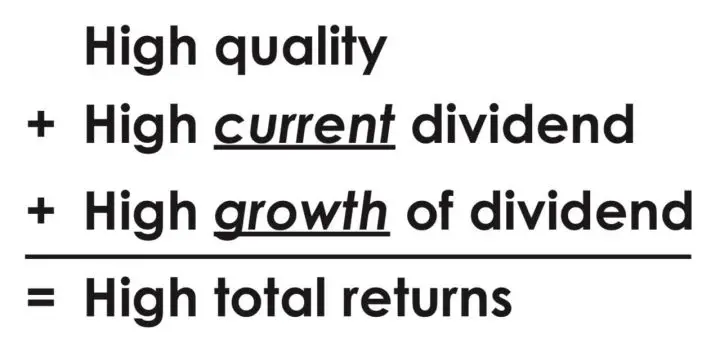
Source: Chapter 4, The Single Best Investment: Creating Wealth with Dividend Growth by Lowell Miller
TIP: I own the physical book, but Lowell Miller has a free PDF of The Single Best Investment: Creating Wealth with Dividend Growth on his Miller/Howard Investments website.
Quality is an important factor, but that’s a topic for another day, so let’s get back to the formula for estimating total returns:
It’s a handy formula because it’s not complicated and it gives you a sense of what a reasonable outcome might be.
Just remember that any time you use long-term estimates you are probably going to be wrong more than you are right.
With that warning out of the way, let’s look at an example highlighted by Daniel Peris in his book Strategic Dividend Investor to see just how accurate this formula has been in the past.
Testing the Total Return Formula Against US Stocks
With the help of Robert Shiller’s data set, Daniel Peris discovered that between 1926 and 2009 total return of the S&P 500 was 9.7% annually.
“The base yield represented 4.2%, and the dividend growth subsequently reflected in capital appreciation provided 4.4%. Not a quarter, not a half, but almost 90% of the market’s historical return has come from dividend payments.”
Daniel Peris, Strategic Dividend Investor
So in this example 4.2% + 4.4% = 8.6% CAGR total return estimate compared to the actual total return of 9.7%.
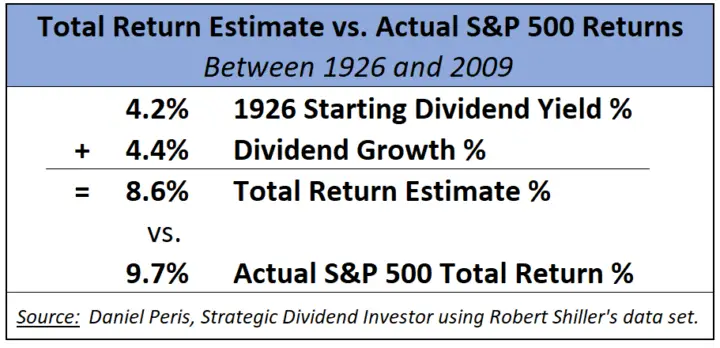
Not perfect, but close. After all, our estimate of 8.6% is ~89% of the actual total returns of 9.7%.
So, over long periods of time with a large group of US stocks, like the S&P 500, the formula was reasonably close.
I got curious about how accurate the total return formula was for Canadian dividend growth stocks so I did a little research myself.
Testing the Total Return Formula Against 78 Canadian Dividend Growth Stocks
First let me say that this isn’t going to be anywhere near as scientific as what Daniel Peris did for the US example we just went over, but it was still an interesting exercise.
I looked at 78 Canadian Dividend Growth Stocks and compared the actual 10-year total return from January 1, 2011, to December 31, 2020, to the formula for our total return estimate.
Remember the formula is: Yield + Dividend Growth = Total Return Estimate
So I took the yield at the beginning of 2011 and added the 10-year average annual dividend growth rate to get a total return estimate. Then I compared it to the actual total return for the same period. Here are the results:
The ones with the closest total return estimate compared to the actual total return are listed first. So, you’ll see at the bottom all the stocks where the gap between the estimate and the actual total return was far apart.
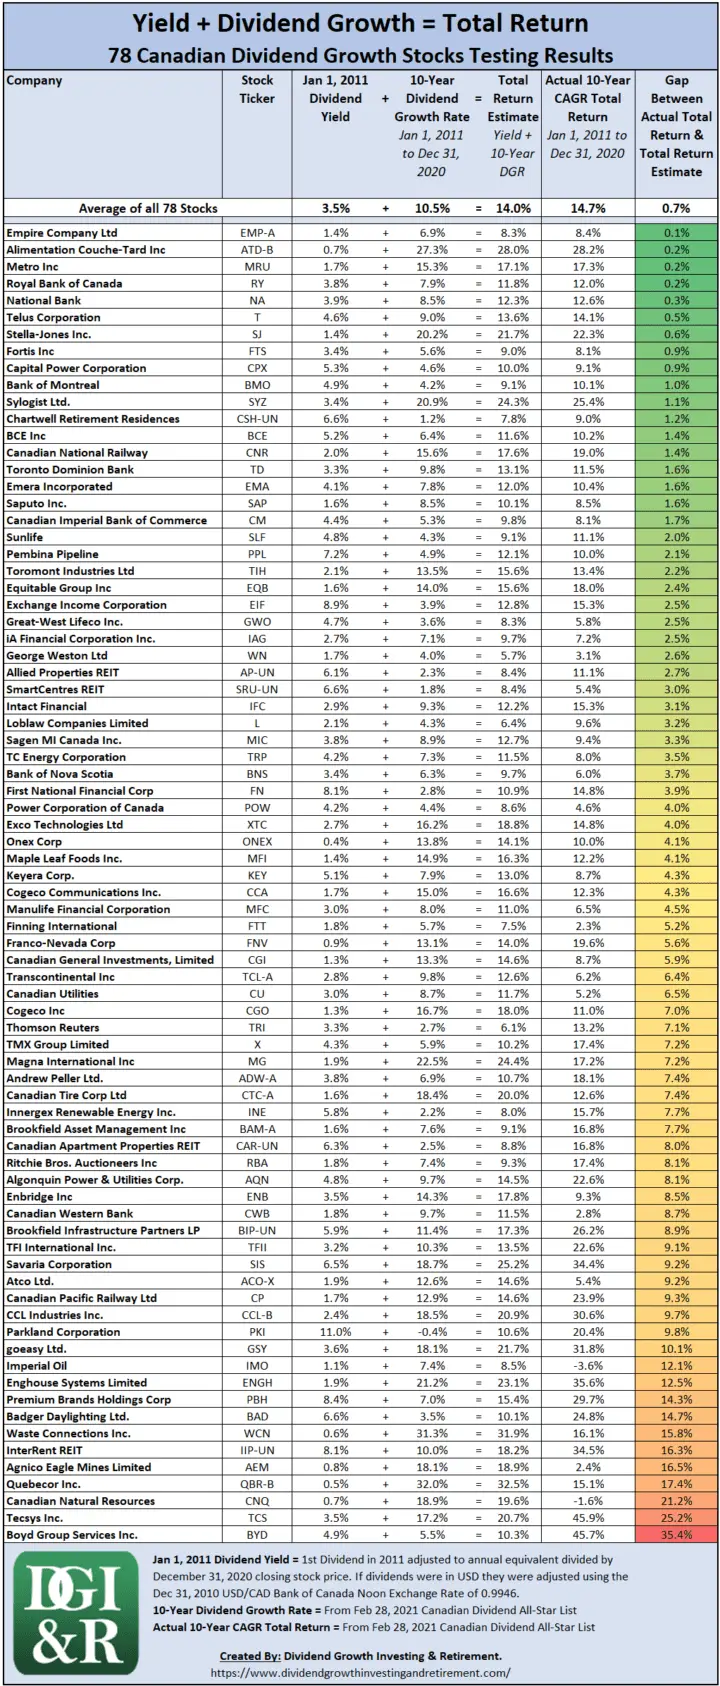
The results as a group were actually quite close. The average of the total return estimates ended up being 95% of the average of the actual total returns.
The average of all 78 total return estimates was a CAGR of 14.0%. This compared the CAGR of 14.7% for the average of all 78 actual total returns for January 1, 2011, to December 31, 2020.
Now you may be thinking, how did I pick these 78 Canadian Dividend Growth Stocks?
Well, I’m lazy so I just used the latest version of the Canadian Dividend All-Star list (CDASL).
The Canadian Dividend All-Star list is an excel spreadsheet with a huge amount of information on Canadian listed stocks that have increased their dividend for 5 or more years in a row.
For the free latest version of the CDASL subscribe below.
Download CDASL
Subscribe to the Dividend Growth Investing & Retirement newsletter and you'll be emailed the download link for the most recent version of the Canadian Dividend All-Star List (CDASL).
As I maintain and update the CDASL on a monthly basis, I have most of the information needed to do this testing already.
So why these 78 companies? Mostly laziness on my part. I did say it wasn’t going to be very scientific 😉
In the February 28, 2021 CDASL there were 100 stocks with 5 or more years in a row of increasing dividends.
Not all of them had 10 years of dividend payments and some I didn’t have a 10-year total return for. These two factors dropped my initial 100 down to the 78 stocks I ultimately looked at.
Final Thoughts on my Lazy Test of 78 Canadian Dividend Growth Stocks
Using some back-of-the-napkin testing on my lazily picked 78 Canadian dividend growth stocks I found out that as a group the total return estimate was quite close (95%) to actual total returns.
While the group of stocks, when averaged out, was close to actual total returns there were still some wide variances among the individual stocks.
Boyd Group Services Inc. (TSE:BYD), for example, had a whopping actual average annual total return of 45.7% for the 10-year period from January 1, 2011 to December 31, 2020. This was way off from the total return estimate of 10.3%.
Pitfalls
When you shorten the time period and apply this to individual stocks, results will vary widely.
Pitfall #1 – No consideration for valuation
When the time period is shortened, the valuation of the stock is going to have a larger impact on total returns. Our simple formula of Dividend Yield + Dividend Growth = Total Return Estimate doesn’t take this into account.
- If the stock is undervalued, then over a shorter period of time I’d expect larger total returns than the formula suggests.
- Conversely, if the stock is overvalued, I’d expect lower total returns than the formula suggests.
Pitfall #2 – Individual stocks vs. a group of stocks are less reliable
We saw in our S&P 500 example that the formula was close (~89%), but when you use this total return estimate on individual stocks the formula becomes less reliable.
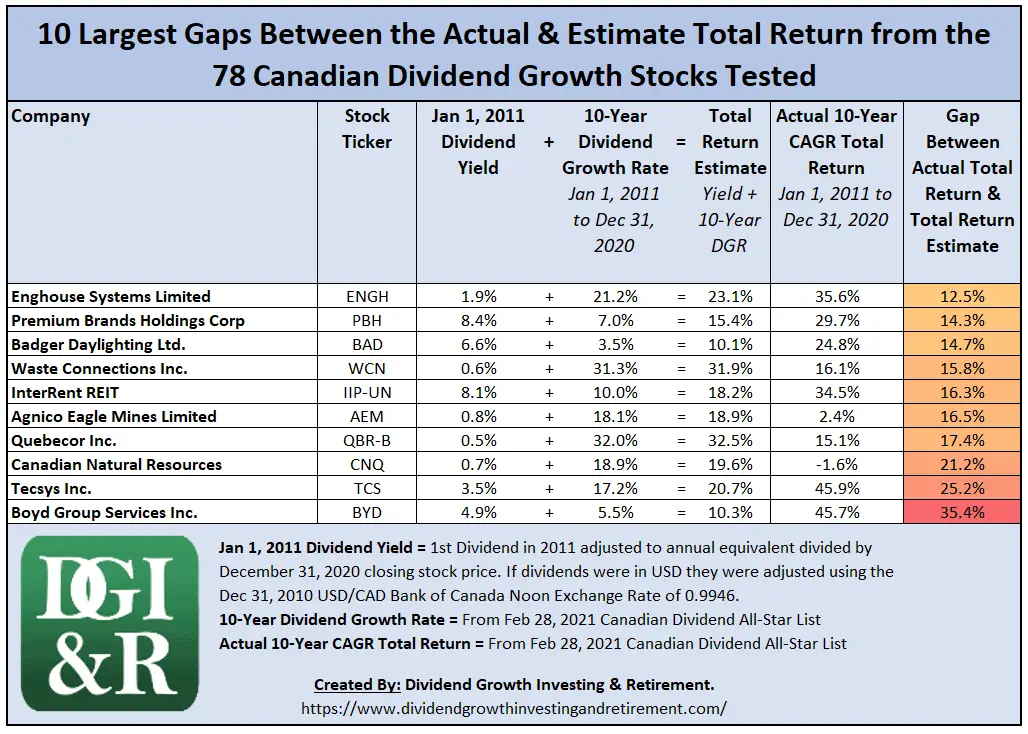
In a group of stocks, there are always going to be outliers that perform much better or much worse. When you use this formula on one stock, you don’t know if your stock is going to be an outlier or not.
In the testing of the 78 Canadian dividend growth stocks, we saw that despite the group average being 95% of the actual total return you still had some large variances with some individual stocks in that group.
Here are the 10 Canadian dividend growth stocks with the widest gap between the actual total return and the total return estimate.
Pitfall #3 – Estimates are unreliable
This pitfall isn’t unique to the formula we are using to estimate total returns but applies to anyone using an estimate. When it comes to predicting the future, we just aren’t that good at it!
Bonus Video: Step-by-Step Instructions on Where to Find Long-Term Dividend Growth Estimates from Value Line, Dividend Stocks Rock & Company Guidance
A key part of the Yield + Dividend Growth = Total Return Estimate formula is finding reliable long-term dividend growth projections to estimate future total returns. Check out this short video to see exactly how I find these dividend growth estimates.
Bottom Line
Dividend Yield + Dividend Growth Estimate = Total Return Estimate is a simple formula, but it has its shortcomings.
Despite all the pitfalls, I still like and use the formula (Yield + Dividend Growth Estimate) as a quick and dirty total return estimate.
I find I’ll use it to weed out stocks with low total return potential vs. relying on it to give an accurate total return estimate.
Plus, it gives you a sense of what a reasonable outcome might be, and it’s also handy to use when comparing two investments.
Newsletter Sign-Up & Bonus
Have you enjoyed our content?
Then subscribe to our newsletter and you'll be emailed more great content from Dividend Growth Investing & Retirement (DGI&R).
BONUS: Subscribe today and you'll be emailed the most recent version of the Canadian Dividend All-Star List (CDASL).
The CDASL is an excel spreadsheet with an abundance of useful dividend screening information on Canadian companies that have increased their dividend for five or more years in a row.
The CDASL is one of the most popular resources that DGI&R offers so don't miss out!


Looking at the stocks that has a big gap I found the yield then and now is very different. E.g. CNQ begins with a yield of 0.7% but right now more than 4%. While PBH begin with more than 8% yield but right now around 2%.
So my guess is valuation plays a big part here. I guess always prudent to buy a stock that is not too expensive. Might miss some very good ones, but also avoided bad ones which are more important for people like me who cannot afford to lose money but OK with return not so high.
Some good points. Valuation definitely factored into the wide gap differences.
DGI&R, I sense that this can be a very useful method of analysis, but I am unclear about something. Normally I would think of capital gains as being part of a 10 year CAGR Total Return. Yet it is being compared against dividend yield plus dividend growth rate, neither of which would seem to include capital gains. Can you please clarify where capital gains enters into this analysis, if it does at all? Thanks.
The formula (yield + dividend growth = total return estimate) doesn’t specifically have capital gains shown in the formula, but capital gains/losses will always be apart of total return.
So capital gains/losses are part of total return but to estimate total return we didn’t need to have it shown in the formula.
Another thing I could point out, is that some believe that capital gains will come from long term earnings growth. In order to pay for a growing dividend, earnings also need to be growing. Otherwise eventually the dividend will become unsustainable and be cut. So if the stock has long term dividend growth, it most likely has long term earnings growth too. There can obviously even some exceptions to this like starting with a really low payout ratio, but in general you get the idea.
Let’s look at the formula again:
Yield + Dividend Growth = Total Return Estimate
In order to have dividend growth you’ll likely need earnings growth and capital gains can come from earnings growth. So while you don’t see capital gains in the formula, the dividend growth part of the formula kind of takes this into account.
Hope that made sense.
Cheers,
DGI&R
OK thanks. So you’re saying that dividend growth is kind of an indirect measure or prediction of capital gains, a proxy. So then would it be fair to say that over long periods, the dividend growth rate tends to be approximately the same as the rate of increase of stock price? If so then it would indeed be a good proxy for capital gains.
Thanks,
Dave
Exactly.
Hi DGI&R,
I truly appreciate that you share your impressive work with us.
I subscribed and received the CADL from mid-February. You mentioned that you have a new list, Feb . 28.
I didn’t receive it. I hope I’m still on your email list! I checked my junk folder and it’s not there.
Can you help?
Many thanks!
Hi Jane,
I checked and the Feb 28 CDASL was emailed out on March 1, 2021 at 6:03am EST in your case. I still see you as a subscriber receiving emails in my system. Not sure where they are landing on your end though (Inbox, Social, Promotion tabs or junk folder, etc.)
I’ll send you a separate email in a few mins and hopefully that will sort it out.
Cheers,
DGI&R
Terrific stuff here … well done!
I was diverted here via Tom Connolly who became my mentor 15 years ago … dear Tom saved my investing bacon when I switched to a dividend growth formula. For a $50 subscription and 6 newsletters it was truly “value for money”, just like my Honda Civic.
My latest purchase was Trans Canada at $54.62. Using the modified formula as supplied by Tom I get a Graham price of around $56 so we will see … The yield is great and there’s been dividend growth for the past 20 years. The only bugbear I see is the debt … money borrowed at cheap rates for a number of infrastructure projects. I expect the cash flow will cover their dividend growth projections of between 5-7%.
I don’t see how you can simply just add the 6% Growth to the Div and come up with 10%/ Year
In the Fortis case, isn’t the 6% Dividend growth the amount the dividend actually grows/year?
So if the Dividend is 4.1% * 6% growth, the resulting dividend growth for the year is $0.246 for a total Dividend of 4.36%.
The formula is an estimate for total return. In your example you are showing only returns from the dividend after 1 year. So yes the dividends in the next year will be higher, but the change in stock price also comes into play. A one year period is too short a period to use this formula for too. It’s mean to be a long-term estimate of total return. Think 10 years or more.
Dividend Yield + Long term dividend growth estimate = Long term Total Return estimate
Hello DGR&I,
Thanks and I still didn’t receive it. I found that I had accidentally put you on my “blocked” list. I’ve fixed that and added you to my “safe” list. Would it be too much to ask you to please email it to me again? Many thanks in advance.
Also for those who are asking – Tom Connolly says that there is a correlation between dividend growth and capital growth. If I understand him correctly, dividend growth leads to capital growth, although I want to study that more.
PS Did you see that Tom Connolly gave you a shout-out? How can people donate to you?
I resent the email. Let me know if you get it.
To donate: https://dividendgrowthinvestingandretirement.com/donate/
Cheers,
DGI&R
Greetings,
Right at the beginning of the article your wrote “Yield + Dividend Growth = Total Return.” and that almost caused me to click off because it is not how Total Return is calculated. I did continue to scroll down and eventually realized you probably meant to write Yield + Dividend Growth = Total Return ESTIMATE. It might be worth correcting the post unless it was some sort of intentional thingy.
I read through the article and this is an interesting way to quickly check a stock to see if it might be a candidate for further investigation. However, I see one problem with it. About 51% of the stocks in the survey show the formula produces a higher number than the actual total return. Provided the investor doesn’t make a purchase soley one the formula number, (and I doubt many who are reading your blog would do that) the real total return will be revealed when they do their due diligence.
But the real problem would arise when the formula produces a number that is lower than the actual total return and the stock get dismissed without further investigation. It would be unfortunate if investors missed the likes of CAR.UN, BAM.A and BAD that are significantly below their actual total returns.
Hi Bob,
That’s a good point about “Yield + Dividend Growth = Total Return.” I had shown in some parts of the article. I’ve updated it now so that they all say “Yield + Dividend Growth = Total Return Estimate” as you suggest. Thanks for pointing this out, it makes the article clearer.
You make some good points about some of the downfalls of using this formula, which is why I only really use it as a quick and dirty estimate to give me a sense of a possible outcome. Bottom-line no one can predict the future, right?
Cheers,
DGI&R
I received your email, thanks so very much!
I will donate soon. I can see that the CADL and your articles are a lot of work!
Nice one thanks for sharing Dividend Earner also did some write up on this topic: https://dividendearner.com/using-chowder-rule/
https://dividendearner.com/how-to-calculate-your-rate-of-return/
Hello from France.
This is a lot of work you do, trying to explain us finance. I am a beginner so please excuse for my questions which may be seem “stupid”.
I am trying to understand your explanations, doing the same calculations with the same file (CADSL feb. 28). But I am not sure that I use the same values (columns) as you, as I don’t find the same results. I use columns “K” and “Q” (having removed n/a values) to calculate the total return estimate. I get 79 lines instead of 78. Then I use column “EU” for the 10-yr CAGR, whose average is 14.9% instead of 14!
Then I find negative values for the gap between actual TR and return estimate.
Is that right? Your explanations will be appreciated.
Thank you very much for that.
Regards
Hello Andre from France!
DGI&R from Canada here.
You won’t be able to do the same calculation with just the CDASL. You need the yield from 10 years ago and the dividend yield you reference in column K of the CDASL is the current dividend yield. I went back to January 1, 2011, and figured out the yield for all these stocks and then added the dividend growth over the next 10 years to get the estimate.
You have 79 lines instead of 78 probably because one of those stocks didn’t pay a dividend on Jan 1, 2011.
Does that make sense?
Cheers,
DGI&R
Great article and report!! Can you show a spread sheet of how you calculated the CAGR of 8.1% for Fortis?
I am assuming you found the total return each year consisting of the share price change plus the dividend. The EV and BV would come from this series of numbers?
Also, this CAGR would not include re-invested dividends correct?
I am trying to analyze the performance of a portfolio of 10 Canadian DG stocks from Jan. 1, 2006 to Dec. 31, 2020. I need to understand how you did this so I can ensure my CAGR is correct.
Thanks.
Hi DGI&R.
There are so many data. Difficult to sort out the most important ones (for me). Why don’t you put the “expected Total Return” you are speaking here, in your file? I am a user of European dividend stocks and this information is available through a dividend growth model.
Thanks for answer.
Best regards