Dividend Growth Investing & Retirement is supported by its readers through donations and affiliate links. If you purchase through a link on my site, I may earn a commission. Thanks! Learn more.
This is a guest post by Bob Ciura, Senior Vice President of Sure Dividend. He oversees all content for Sure Dividend and its partner sites. Prior to joining Sure Dividend, Bob was an independent equity analyst. Bob received a Bachelor’s degree in Finance from DePaul University and an MBA with a concentration in Investments from the University of Notre Dame.
⭐ Find dividend growth stocks that have survived multiple recessions and increased dividends for 5, 10, 25+ years in a row.
Stock market investors want to buy shares that will provide the highest returns. While this statement may seem obvious on the surface, it is more complex than it seems. That’s because stocks rise and fall every day, sometimes without a clear reason, which might imply a great deal of randomness in the stock market.
But at its core, stocks provide returns in two ways: a higher share price (a function of earnings growth and changes in the valuation multiple), and dividends. The latter — dividends—are relatively self-explanatory, as the dividend yield is easy to find. But the former — changes in earnings growth and multiple expansion or contraction — are harder to decipher.
With that in mind, we have a specific formula for determining a stock’s future expected returns. It takes into account earnings growth and changes in the valuation multiple, as well as dividends.
We believe dividend growth investors can generate the best returns by focusing on the best dividend growth stocks, such as the US Dividend Aristocrats, that can deliver a positive combination of all three qualities.
Why Invest In Dividend Growth Stocks?
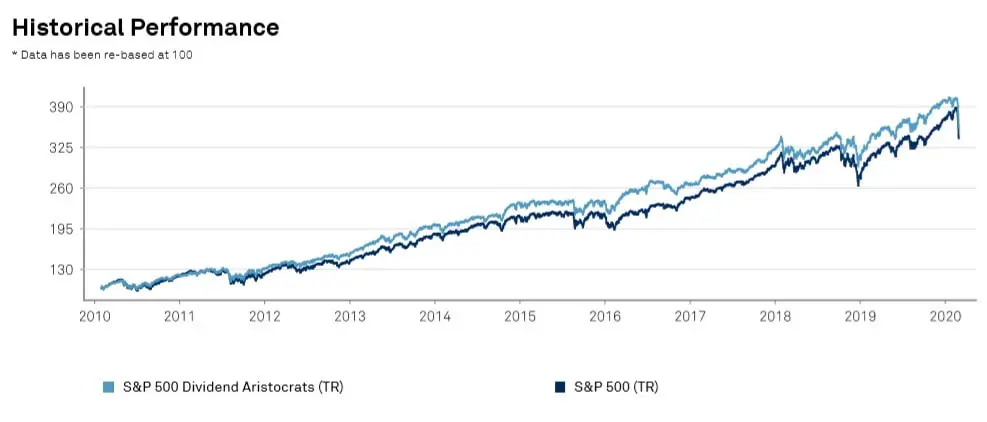
At Sure Dividend, we broadly favor high-quality dividend growth stocks such as the US Dividend Aristocrats, a group of stocks in the S&P 500 Index that have each raised their dividends for 25+ consecutive years. This is because, in our view, the Dividend Aristocrats offer the strongest return potential over the long-term. There is ample evidence to back this up; in fact, the Dividend Aristocrats have actually outperformed the broader market in bull markets and bear markets.
For example, consider the 10 years immediately following the Great Recession of 2008-2009, when the U.S. stock market bottomed and began a historic decade-long bull run. Investors might assume that steady dividend stocks would underperform in a bull market, but this was not the case. According to Standard & Poor’s, which tracks and maintains the Dividend Aristocrats index, these high-quality dividend growers outperformed in the 10 year period after the Great Recession ended, even in a raging bull market.
Source: Standard & Poor’s
The Dividend Aristocrats also outperformed the S&P 500 during the Great Recession of 2008-2009. This proves that high-quality dividend growth stocks are capable of outperforming the market not just during recessions and market downturns, but also during economic expansions when share prices are rising. We believe the Dividend Aristocrats are still among the best dividend growth stocks to buy for long-term dividend growth.
Broadly speaking, the Dividend Aristocrats widely possess attractive qualities that make them strong long-term investments. The Dividend Aristocrats have established track records of growth that have given them leadership positions in their respective industries. Most Dividend Aristocrats are the #1 or #2 competitor in their given economic sector. Furthermore, they are large companies with global business models that have durable competitive advantage and economies of scale. These qualities give them the ability to navigate recessions, when so many smaller competitors may be put out of business.
Moreover, the largest companies in a given sector have the financial strength to invest heavily in R&D and new product development to stay ahead of the competition. Alternatively, if an upstart competitor does manage to enter a given market and take share from an established leader, the individual Dividend Aristocrats can simply acquire them to retain their market leadership. For example, AT&T (NYSE:T) acquired Time Warner for ~$100 billion to instantly become a leader in content, while AbbVie (NYSE:ABBV) acquired Allergan to diversify its pharmaceutical portfolio. These are just two examples of major deals that allow Dividend Aristocrats to further cement their market share.
Our Formula For Expected Stock Returns
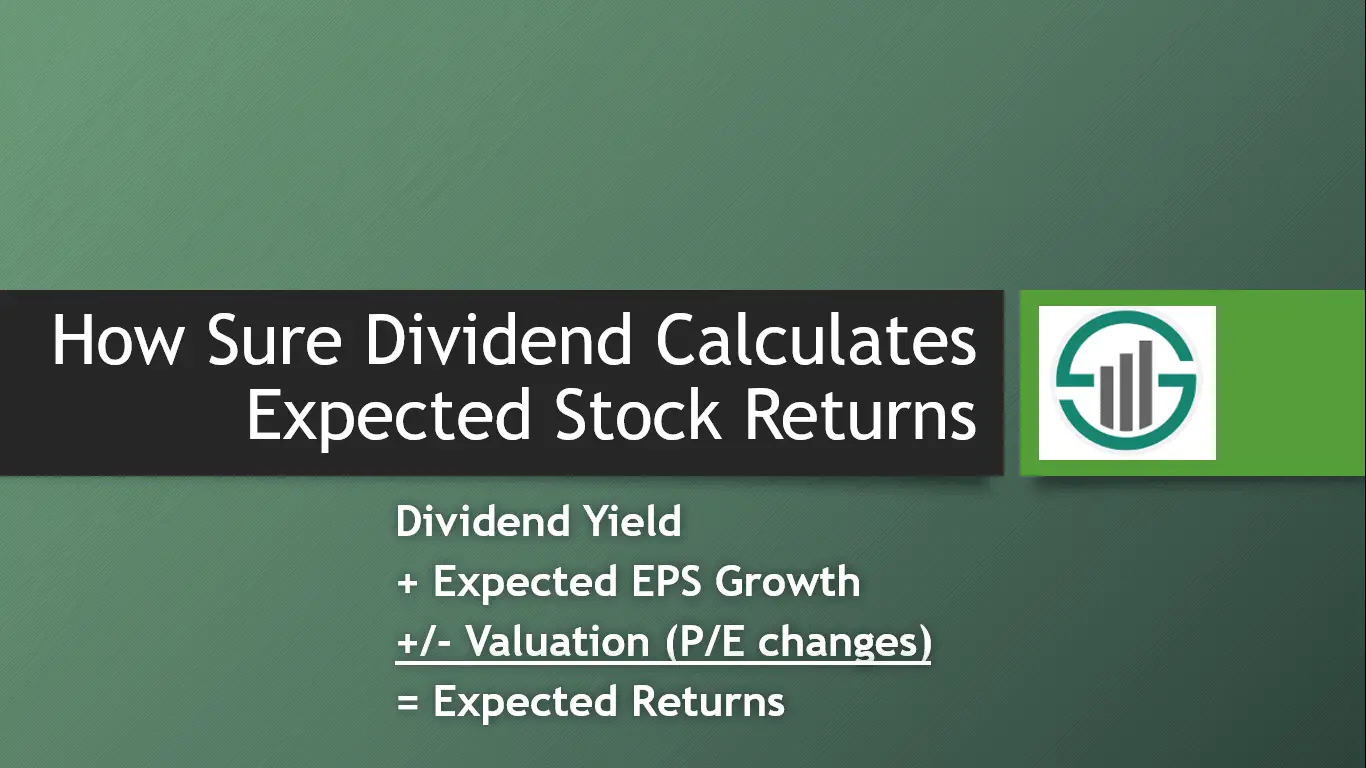
We estimate expected returns for every stock in our coverage universe. We then rank our individual stock picks based on which companies are expected to generate the highest total returns over the next five years. Our formula has three basic components: the stock’s dividend yield, five-year expected annual earnings-per-share growth, and changes in the price-to-earnings ratio.
Dividend Yield + Expected EPS Growth +/- Valuation (P/E changes) = Expected Returns
First, investors receive a return through dividends. This is indicated by the dividend yield, which is the annual dividend payout divided by the share price.
Then, earnings-per-share is the profit that a company generates on a per-share basis, and can be found on the income statement. The main factors that influence earnings-per-share are revenue, less all expenses. Share repurchases can also positively contribute to a company’s earnings-per-share.
Lastly, investors need to assess how investors value a company’s EPS, and the valuation multiple of each stock. This is typically done with the price-to-earnings ratio, which takes a company’s share price and divides it by the earnings-per-share. Stocks trading with a P/E ratio below what an investor believes to be fair value are considered undervalued.
Expected Annual Returns % from Valuation (P/E changes) =

In our view, the best stocks to buy are expected to generate positive returns across all three components. We favor companies that can generate positive earnings-per-share growth, have solid dividend yields, and are undervalued based on P/E ratio and therefore are likely to see their valuation multiples expand.
Walgreens Boots Alliance (NASDAQ:WBA): A 2020 Example
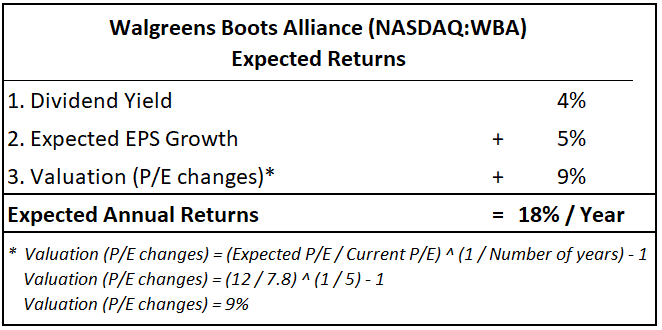
It’s early 2020 and Walgreens Boots Alliance is a US dividend aristocrat that runs a chain of pharmacies primarily in the US. Walgreens has a high dividend yield of 4.0%, and the company has increased its dividend for 44 consecutive years.
The stock has been hit hard over the past year by a number of headwinds, including a weak retail environment as well as fears of heightened online pharmacy competition from the likes of Amazon (NASDAQ:AMZN). But we view WBA positively over the long-term, due to its durable competitive advantages, specifically its strong brand and entrenched retail footprint.
While future growth is likely to be limited due to the company’s investments in new partnerships and store renovations, we expect 5% annual EPS growth through 2025.
In addition, the stock appears cheap, with a 2020 P/E ratio of 7.8 based on a recent share price of ~$47 and expected EPS of $6.00.
In the past 10 years, WBA stock held an average P/E ratio of ~16, which indicates the stock is significantly undervalued.

Source: Walgreens Boots Alliance March 13, 2020 Value Line Report
If Walgreens returns from its current P/E of 7.8 to a P/E of 12, which we believe is a reasonably conservative multiple, the stock would generate positive annual returns of 9.0% per year from an expanding valuation multiple.
Putting the three pieces together — Dividends, EPS growth, and P/E multiple expansion — WBA stock has a five-year expected return of 18% per year.
4% Dividend Yield + 5% Expected EPS Growth + 9% Valuation (P/E changes) =
18% Expected Annual Returns
18% is a high expected rate of return and is just one example of a US Dividend Aristocrat that we viewed favorably in early 2020 for long-term dividend growth investors.
This is the methodology Sure Dividend employs to find high-quality dividend growth stocks that could generate superior long-term returns. There are many high-quality dividend stocks that we recommend in our two monthly newsletters.
Newsletter Sign-Up & Bonus
Have you enjoyed our content?
Then subscribe to our newsletter and you'll be emailed more great content from Dividend Growth Investing & Retirement (DGI&R).
BONUS: Subscribe today and you'll be emailed the most recent version of the Canadian Dividend All-Star List (CDASL).
The CDASL is an excel spreadsheet with an abundance of useful dividend screening information on Canadian companies that have increased their dividend for five or more years in a row.
The CDASL is one of the most popular resources that DGI&R offers so don't miss out!


Thanks for spelling out how it is you come up with your recommendations. It can seem sometimes a bit complicated to someone new to the field.
Great post! Love learning new tools.
Question, on tool do you use to find your stock data (Expected EPS, PE,…)?
Thanks.
Sure Dividend sources their data from a variety of different places. They use ValueLine for historical EPS and P/E ratios. They also utilize earnings releases and annual reports from a company’s investor relations site.