Dividend Growth Investing & Retirement is supported by its readers through donations and affiliate links. If you purchase through a link on my site, I may earn a commission. Thanks! Learn more.

The Value Line Investment Survey is an extremely valuable investment research resource that I use all the time when researching dividend growth stocks. I’m going to use the largest Canadian company by market cap (As of August 2018); Royal Bank of Canada (TSE:RY), to show you how I use their one-page reports to quickly assess dividend growth stocks.
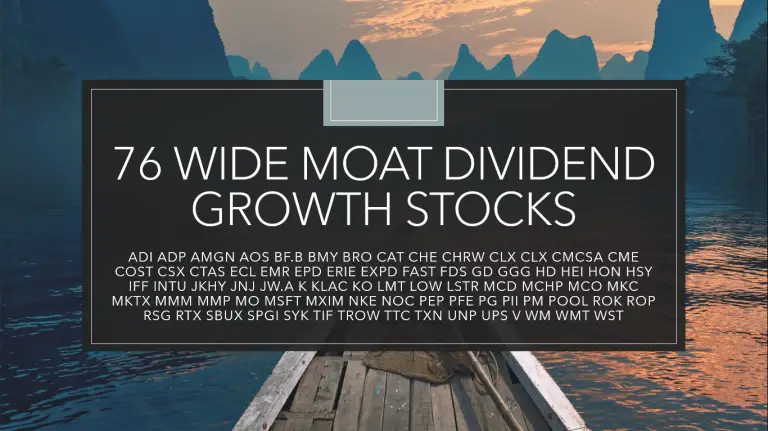
⭐ Find dividend growth stocks that have survived multiple recessions and increased dividends for 5, 10, 25+ years in a row.
The Best One-Page Reports Out There
Value Line does a number of things well, but what I find most useful is their one-page company summaries, which I consider the best out there.
“The same information is available from other places […], but few alternatives can boast the concise historical display of 17 years of data that youʼll find in Value Line. This is why I find it valuable; you can quickly spot long-term patterns and trends because the data is all laid out in front of you. Too, key ratios are shown in a sensible and logical manner, right where a user needs them.”
Source: The Single Best Investment: Creating Wealth with Dividend Growth by Lowell Miller (Affiliate link, but I personally own and highly recommend this book.)
Tip: Check your library. Many North American libraries have free access to the Value Line Investment Survey, where you can find these one-page reports.
Related article: How to get free online access to the Value Line Investment Survey in Canada [+ list of Canadian stocks covered by Value Line]
Sample Report
Before we get into the Royal Bank of Canada example, I wanted to share one of Value Line’s sample reports because it also contains explanations of all the different sections in the report which will be helpful to first-time users.
Download the August 2013 Johnson & Johnson (NYSE:JNJ) sample PDF report here.
How to use Value Line Investment Survey Reports to Quickly Assess Dividend Growth Stocks: Royal Bank of Canada Example
The first thing I look at in the Value Line reports is the company’s financial strength rating.
Financial Strength
Value Line’s financial strength rating ranges “from an A++ for the most financially stable firms, to C, for companies that are in serious financial difficulty.” (Source: Value Line Ranking System)
This is “All-or-nothing” criteria for me, which is why I look at it first. If I don’t see at least a B+ rating or higher then I shouldn’t be investing for two main reasons:
- As a long-term investor, I’m only interested in companies that have a good chance of being around decades from now. A strong financial strength is an important part of this.
- As a dividend growth investor, I want companies that can grow the dividend. When debt gets too high dividend growth usually slows or stops as the company focuses more on paying down debt to more reasonable levels. A common example would be when a company is at risk of losing their investment grade credit rating so they cut the dividend or stop increasing it and use that cash to pay off debt more aggressively.
Royal Bank of Canada has an “A” rating, so looks good so far.
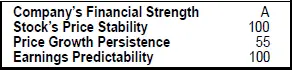
Source: Value Line Royal Bank of Canada report, August 10, 2018
Financial Strength: Check the Four Credit Rating Agencies too
In addition to Value Line’s financial strength rating, I look at the four other major credit rating agencies: S&P, Moody’s, DBRS, and Fitch. (FYI – you can set up a free account with all four to access company ratings)
I want to see at least a BBB+/Baa1/BBB (high) rating from the credit rating agencies. The exception again is for utilities in which case I’m OK to go as low as BBB/Baa2.
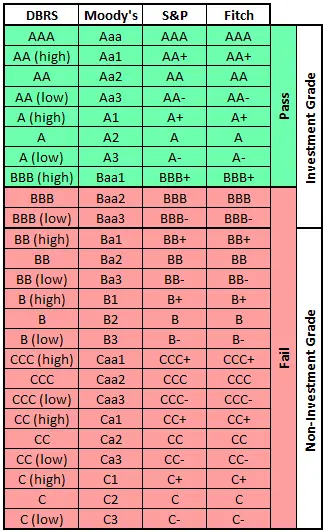
It’s unusual to have companies rated by all four agencies (Usually just one or two), but in Royal Bank’s case, they have ratings from all four.
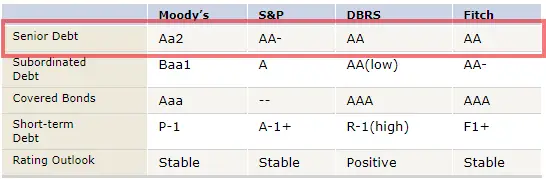
Source: http://www.rbc.com/investorrelations/fixed-income-investors.html
Royal Bank has high ratings from all four agencies, so everything still looks good.
Value Line Safety Ranking
Some people will also look at the safety rating (1 highest to 5 lowest) and focus on those rated 1 or 2. The safety rating uses a combination of the financial strength rating and the Price Stability index of a company. I’m ok with volatility so I usually just look at financial strength but to each their own.
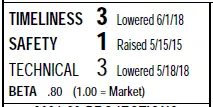
Source: Value Line Royal Bank of Canada report, August 10, 2018
You can learn more about the Timeliness, Safety, and Technical rankings from Value Line here.
Sales, Earnings and Dividend Growth
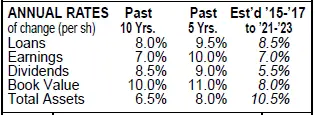
Next, I want to see that the company has a history of growing sales, earnings, and their dividend and that they can continue to do so. Value Line summarizes it all with their “Annual Rates” table which has 5 and 10-year average growth rates and 3 to 5-year estimates for future growth.
Source: Value Line Royal Bank of Canada report, August 10, 2018
Royal Bank is showing respectable growth rates with sales (Loans), earnings and dividend growth all over 7% per year on average for the past decade. It looks like they expect this trend to continue with dividends, earnings, and loan growth estimated at 5.5%, 7.0% and 8.5% per year on average over the next 3-5 years.
The dividend growth estimate at 5.5% is a bit on the low side for me, as I like to shoot for 8%, but Royal Bank has a dividend yield of almost 4%, so I’d still be willing to consider it. For higher yielding companies I’m willing to accept a lower dividend growth estimate.

Source: Value Line Royal Bank of Canada report, August 10, 2018
Remember the dividend yield and the 12.1 price-to-earnings (P/E) ratio for later when we look at valuation.
Value Line Historical Array: Year by Year Trends & Finding Quality
In conjunction with the “Annual Rates” table I’ll look at the annual figures in the “Historical Array” section to see how volatile earnings, sales, dividends, etc. are from year to year. Value Line reports show annual figures going back for more than a decade (2002 to 2017 in the Royal Bank example) and has their estimates for a few years in the future (2018 and on for the Royal Bank example).
I can see that earnings (Top red box in historical figures below) mostly go up each year and there aren’t any wild up and downs year to year. I prefer companies with earnings consistency and Royal Bank fits the bill.
The dividend (Top red box) has been going up each year, with the exception of 2008 to 2010 when it was kept steady at $2.00 annually as the company weathered the global financial crisis. This is a good history of dividend growth and it appears sustainable as the dividend payout ratio (Bottom red box) in 2017 was 47% and has ranged from 43% to 61% going back to 2008. I like to try for a payout ratio of 60% or less (70% for utilities).
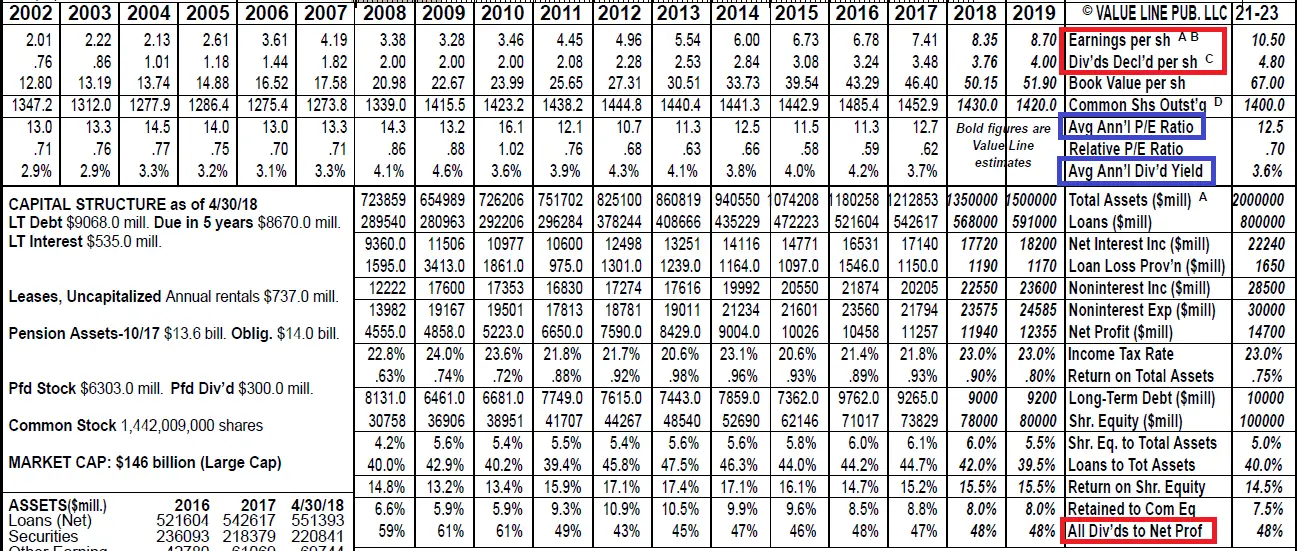
Click image to enlarge. Source: Value Line Royal Bank of Canada report, August 10, 2018
Ideally, I’m looking for profitable companies that make more and more money over time to fuel dividend growth. Royal Bank of Canada seems to fit in nicely with earnings, dividends, etc. trending in the right direction.
Finding Quality: Check Morningstar too
I also like to check Morningstar’s moat rating to see if the company has a sustainable competitive advantage.
Tip – Check to see if your broker provides access to Morningstar. I use Questrade which has free access to Morningstar research. (Affiliate link, but I’ve been using Questrade for years and I consider them the best low-cost broker in Canada)
“The idea of an economic moat refers to how likely a company is to keep competitors at bay for an extended period. One of the keys to finding superior long-term investments is buying companies that will be able to stay one step ahead of their competitors, and it’s this characteristic–think of it as the strength and sustainability of a firm’s competitive advantage–that Morningstar is trying to capture with the economic moat rating.”
Source: Morningstar definition of “Economic Moat”
Morningstar gives Royal Bank of Canada a wide moat which suggests a strong and sustainable competitive advantage. Typically, I want to see a wide or narrow moat rating from Morningstar.
Valuation
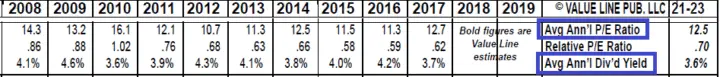
We saw earlier that the current P/E for Royal Bank was 12.1 and the dividend yield is 3.9%. Compare this to average annual P/E ratios and dividend yields (Blue boxes from the previous table, and 2008 & on shown below).
Source: Value Line Royal Bank of Canada report, August 10, 2018
Over the past decade, average annual P/E ranged from 10.7 to 16.1, and average annual dividend yield ranged from 3.7% to 4.6%. Compared to a current P/E of 12.1 and a yield of 3.9% Royal Bank of Canada looks like its trading around fair value as current rates are roughly in line with historical averages.
Value Line also gives 3-5 year stock price estimates which can also be helpful when trying to gauge valuation.
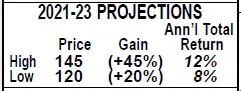
Source: Value Line Royal Bank of Canada report, August 10, 2018
For Royal Bank of Canada they are estimating 8-12% annual total returns (Includes the dividend).
Valuation: Check Morningstar too
In addition to Value Line, I’ll use Morningstar, which uses a discounted cash flow analysis to estimate fair value and assign a 1 to 5 star rating (5 undervalued, 3 fair-value, 1 overvalued).
As of August 18, 2018, Morningstar gave Royal Bank of Canada 3 stars with a fair value estimate of $107 CAD. Their 5-star price is $74.90 CAD.
Ideally, I’m looking to invest in high-quality undervalued companies, but I will invest at fair value when the company is a quality company and showing a combination of high yield (4% or higher) and high estimated annual dividend growth (8% or higher). Royal Bank of Canada is a high-quality company, but I’m missing the 8% dividend growth estimate.
Business Overview & Analyst Comments
If I’m not familiar with the company I’ll read the Value Line business description, and I also like to take a look at the most recent (updated quarterly) comments from the Value Line analyst to get a quick idea if there are any big events that I should be aware of.
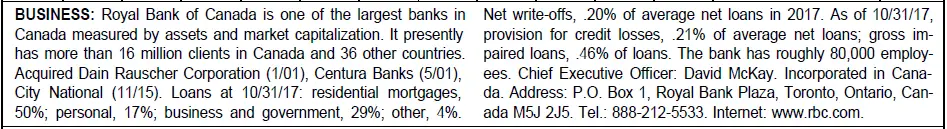
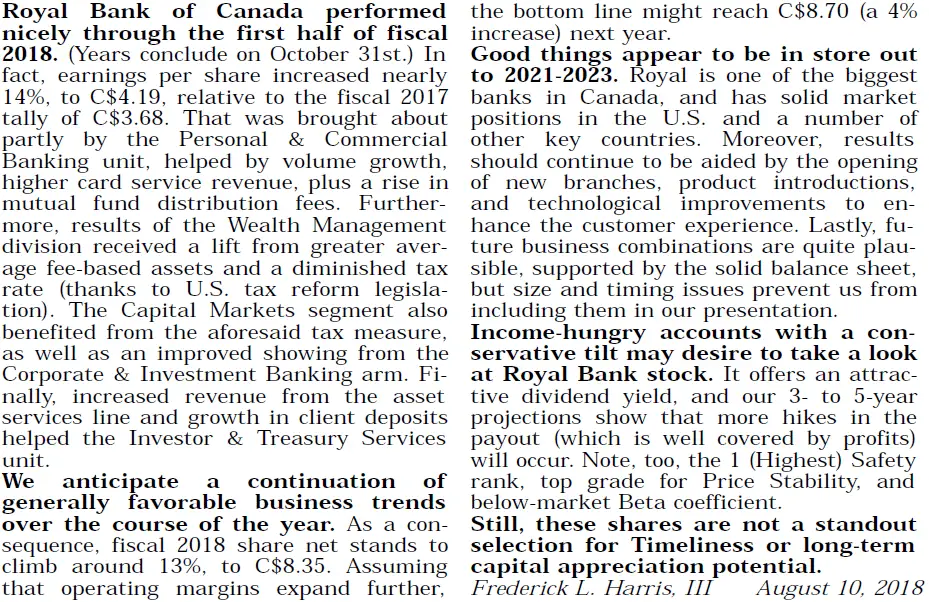
Source: Value Line Royal Bank of Canada report, August 10, 2018
And that’s pretty much it. There is more information in Value Line reports than I’ve shown here, but from a dividend growth perspective, these are the main areas I’m looking at.
Summary
The Value Line Investment Survey one-page reports are one of the best out there and a great resource for quickly assessing a dividend growth stock. When I review a company with Value Line Investment Survey reports I look for:
- A Financial strength rating of B+ or higher,
- A history of consistent sales, earnings, and dividend growth along with high future growth estimates in the “Annual Rates” table and “Historical Array” section,
- An undervalued company by comparing the current P/E and dividend yield to historical averages in the “Historical Array” section and looking at Value Line’s total return projections, and
- Important information that I should be aware of in the Value Line analyst comments and business overview section.
The Value Line Investment Survey is an amazing resource, but I still like to supplement their research with some from Morningstar and the four major credit rating agencies in order to get a more complete picture. I also:
- Check Morningstar’s moat rating and look for narrow or wide moat companies,
- Check Morningstar’s fair value estimate to see if the stock is trading at or below fair value, and
- Check the credit ratings from S&P, Moody’s, DBRS, or Fitch and look for a rating of BBB+/Baa1/BBB (high) or better.
Newsletter Sign-Up & Bonus
Have you enjoyed our content?
Then subscribe to our newsletter and you'll be emailed more great content from Dividend Growth Investing & Retirement (DGI&R).
BONUS: Subscribe today and you'll be emailed the most recent version of the Canadian Dividend All-Star List (CDASL).
The CDASL is an excel spreadsheet with an abundance of useful dividend screening information on Canadian companies that have increased their dividend for five or more years in a row.
The CDASL is one of the most popular resources that DGI&R offers so don't miss out!


s.o
Wow amazing tutorial. Superb detailed. It’s exactly what I was looking for. I had trouble finding the credit ratings. Thanks to you it should be easy now.
Also it would be awesome if the credit details and some of the details you mentioned from morningstar can be added to the “all star sheet” (if it’s legal ofcourse)
I could try to help you scrape the data from them.
Many thanks!!
That’s some great lessons on dividend income. I have always believed in holding to those stocks that have stayed active for years – regardless of how bad or good – and it has yielded a very good side, passive income for me over the years. Thanks for compiling this.,