Dividend Growth Investing & Retirement is supported by its readers through donations and affiliate links. If you purchase through a link on my site, I may earn a commission. Thanks! Learn more.

Welcome to part four of The Great Canadian Banking Series. In this 10 part series I examine the Canadian banking sector to identify good dividend growth candidates. In part two of the series I looked into Bank of Nova Scotia and in part three I looked at Toronto-Dominion Bank. Today I’ll be looking into Royal Bank of Canada.
Before I start the dividend stock analysis I want to mention to new readers that there is another article that you may want to read first. The other article better explains what I’m looking for in a company from a dividend growth perspective and why I analyze specific company components and ratios. The other article is meant more as an educational tool so that readers can better understand my dividend stock analyses. This dividend stock analysis will look at the company to identify if it is a good dividend growth candidate to invest in.

⭐ Find dividend growth stocks that have survived multiple recessions and increased dividends for 5, 10, 25+ years in a row.
Company Description
From Google Finance:
“Royal Bank of Canada (RBC) is a diversified financial services company. RBC provides personal and commercial banking, wealth management services, insurance, corporate and investment banking and transaction processing services on a global basis. Its International Banking segment includes its banking businesses in the United States and Caribbean, as well as its 50% interest in RBC Dexia Investor Services (RBC Dexia IS). RBC Bank in the United States provides a line of products and services through 426 banking centers and approximately 480 automatic teller machines (ATMs). RBC provides customized trust, banking, credit and investment solutions to clients in 21 countries worldwide. In July 2012, it acquired 50% stake of RBC Dexia Investor Services Limited from Banque Internationale a Luxembourg S.A. In February 2013, it acquired the Canadian automotive finance and deposit business of Ally Financial Inc. In April 2013, it acquired Athena Energy Group of Cos.”
10 Year Stock Chart
There is a 10 year annual average return of 8.2%. If we include the dividend payments over the past 10 fiscal years (Total dividends paid of $16.67) then the total average annual return would be 10.7% with the average return from dividends representing 2.5%.

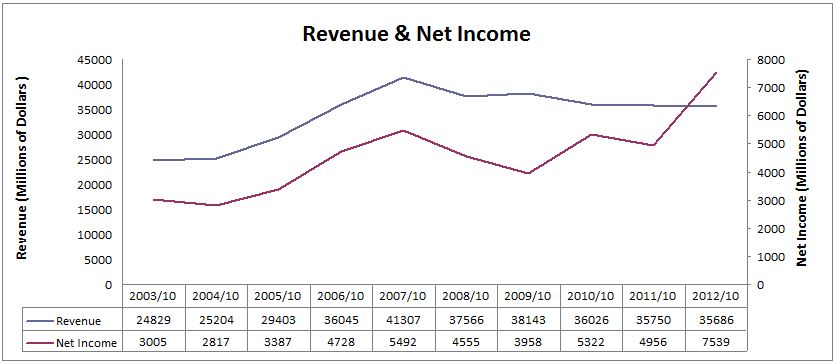
Revenue and Earnings
Royal Bank of Canada’s net income has been trending up, but revenue has been mostly flat since 2007.
Revenue per share has been declining since 2007, but we’ve see a growing EPS from 2009 and on. This would suggest that the company is getting more efficient. I like that EPS is growing, but I’d like to see revenue per share grow as well.
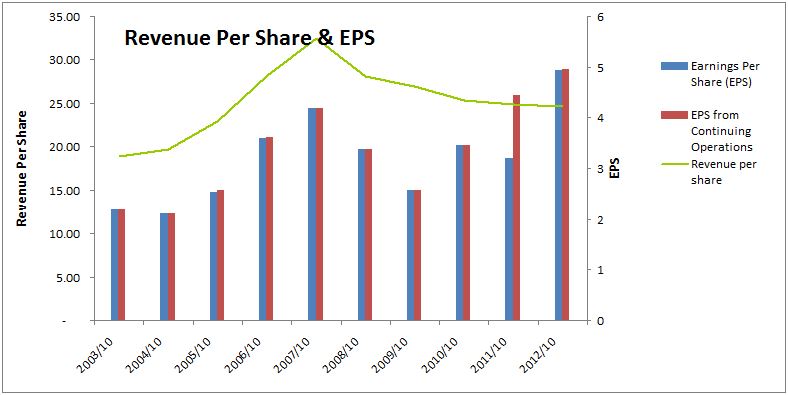
Royal Bank of Canada has OK earnings charts. I’d like to see more consistent and growing earnings. The trend in revenue is a little worrying, and I’d like to see revenue start to grow again.
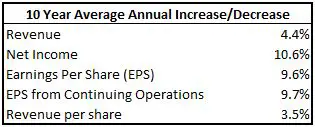
Net income and EPS growth rates are good, but the revenue figures are low. I typically like to see rates above 8%. When I looked at the 2012 annual report it stated that the 2013 target growth rate for diluted EPS is 7% or more.
Dividends
Royal Bank of Canada has increased their dividend for 2 consecutive years in a row. Prior to this the annual dividend was held at $2.00 for the three fiscal years from 2008 to 2010. The dividend streak leading up to the stalled dividend in 2008 was 14 years.
The quarterly dividend recorded in April 2013 of $0.63 (up from $0.60) was their most recent increase, but they’ve been increasing their dividend twice a year for the past few years. The quarterly dividend recorded in October 2012 was increased from $0.57 to $0.60. The most recent annual dividend increase would be from $0.57 to $0.63 which is an increase of 10.5%.
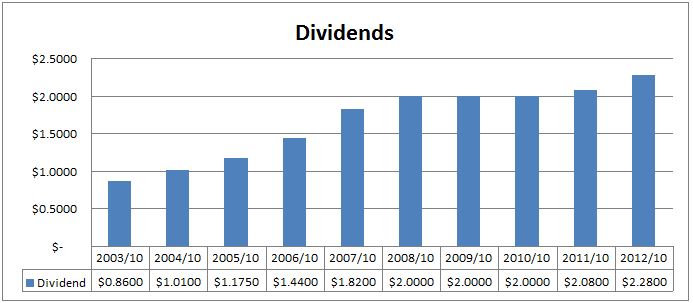
In the chart you can see where dividend growth stalled from 2008-2010. The overall trend is good, and it looks like dividend growth has started to improve since the global financial crisis.
Dividend Growth
As you can see from the table below Royal Bank of Canada shows good 1 and 10 year average annual dividend growth rates, but leaves me wanting more with the other rates.
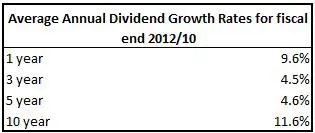
You can see the affects of the global financial crisis on the 3 and 5 year average annual dividend growth rates. The 10 year rate is good, and it looks like dividend growth has improved recently with the 1 year rate of 9.6%.
Dividend Sustainability
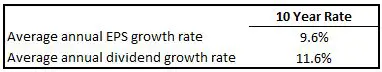
The 10 year average annual dividend growth has been slightly above earnings growth which points to sustainable dividend growth.
Let’s take a look at the payout ratio to see how much room for further dividend growth there is.
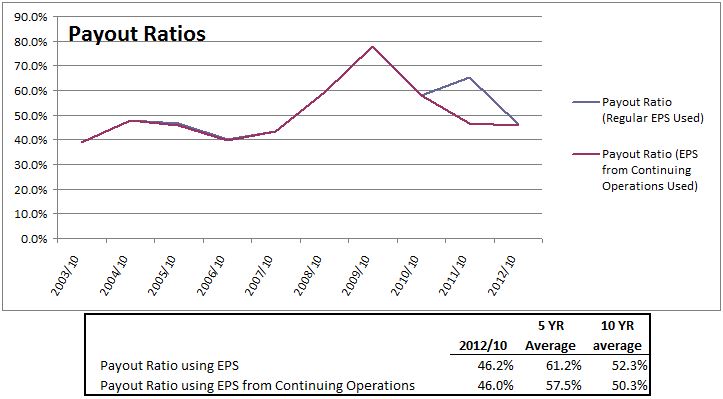
In the past few years the payout ratio has generally been around 50-60%. In their 2012 annual report they stated that they are targeting a payout ratio of 40-50%. This is consistent with other banks like CIBC and Bank of Montreal which have stated the same targets.
Estimated Future Dividend Growth
Analysts expect annual EPS growth to be 8.0% for the next 5 years. Accepting this EPS growth rate and using various payout ratios we can guess future dividend growth rates.

I expect a payout ratio of 40% to 50%. This would result in annual dividend growth ranging from 4.9% to 9.7%. The company’s most recent annual dividend increase of 10.5% leads me to think that future dividend growth will be at the higher end of this range.
Competitive Advantage & Return on Equity (ROE)
ROE is has been up and down. Typically I like to see a steady or growing ROE. In Royal Bank of Canada’s 2012 Annual Report they stated that they are targeting a ROE of 18% or more.
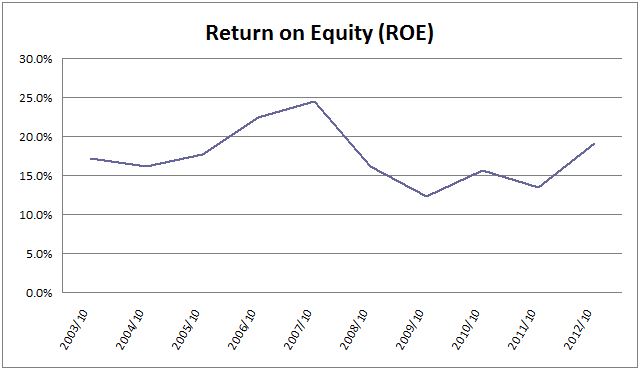
Looking at the table below, it looks like Royal Bank’s ROE has been in-line with the industry average.
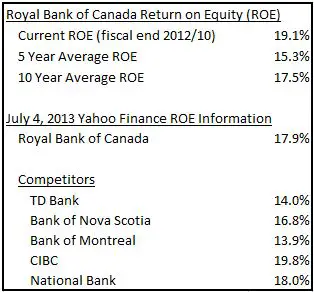
The Canadian banking industry is dominated by the big six banks. The big six are all very competitive so while there are not a lot of big players in the Canadian market, it is still very competitive. Morningstar rates Royal Bank of Canada as having a narrow economic moat. I would agree with this rating.
Debt & Liquidity
I want to invest in companies that are fiscally responsible, so it is important to look at debt levels and see that they are at reasonable levels.
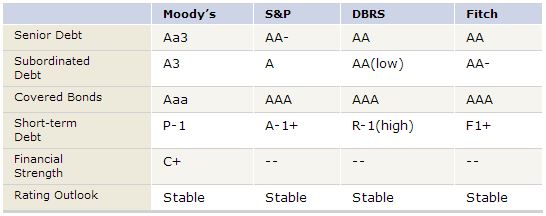
Based on what the different rating agencies say, the company seems to be in good financial health.
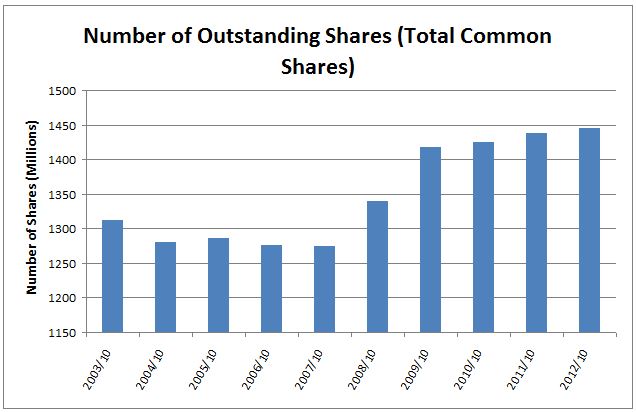
Shares Outstanding
It looks like shares outstanding have been increasing since 2007. I’d like to see this trend reverse.
Valuation
I use the low price averages for 6 main ratios to determine a fair price: Yield, Discount/Premium of the low price compared to the Graham Price, P/E, P/B, P/Sales and P/Cash flow. I like to look at both EPS and EPS from continuing operations so it ends up being a total of 8 ratios as the Graham Price an P/E both use EPS. I was unable to get all the P/Cash flow information I needed, so it wasn’t used. You can read more about my valuation method here.
I get the following for Royal Bank of Canada.
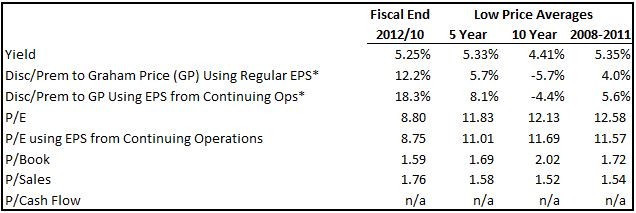
* The discount or premium to Graham Price hasn’t been calculated in the normal fashion. For the details read this article.
I use the averages from the previous table to determine my target price. Using these averages creates a lot of different target prices, so I back-test this strategy over the past 10 years. I identify which of the 8 valuation techniques would have given me a chance to buy the stock in two to three fiscal years in the past 10 fiscal years. It’s not always possible to test my strategy back 10 years, due to limited financial information, but I do my best. The results are highlighted below.
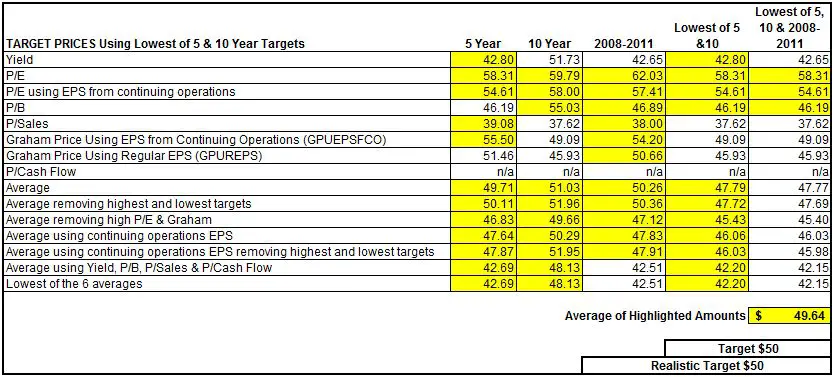
The average of the highlighted amount gives me a target price of $50. This would result in a dividend yield of 5.04% with the current annual dividend of $2.52. I think this a reasonable target, so I left the realistic target at $50.
Morningstar currently rates Royal Bank of Canada as a 3 star stock as it is currently priced close to their estimated fair value of $57. For Morningstar to rate Royal Bank of Canada as a 5 star undervalued stock the price would have to fall below their “consider buy price” of $34.20.
My target price of $50 is 46.2% higher than Morningstar’s 5 star target. This is quite a difference, so I was worried that my target price wasn’t conservative enough. Whenever I need a tie breaker for valuation I like to use dividend yield. The 5 star price would result in a dividend yield of 7.37%, and my target price a yield of 5.0%. When I look at the past 10 fiscal years it looks like a yield of 5.0% is still conservative compared to past dividend yields.
![]()
Morningstar’s 5 star price is very conservative, and it looks like the only opportunity to buy at a 7.37% yield would’ve been in 2009 in the height of the global financial crisis. Having looked at historic high dividend yields, I’m content to keep my target price at $50. You can see all of my target prices here.
Trend Analysis
I also like to look at INO`s Free Trend Analysis prior to investing to see if I should hold off or not. Sometimes it is nice to see if the stock is trending down or up before buying it. For July 26, 2013 INO is showing an uptrend for Royal Bank of Canada.
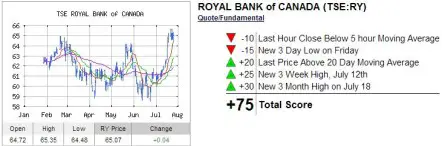
To see the most recent trend analysis for Royal Bank of Canada or to sign up for free trend analysis’s click here. INO also has a list of the top 50 trending stocks and free trading seminars and videos.
Other Investment Options in the Same Industry
Royal Bank of Canada is one of six banks that make up the majority of the Canadian market. They share the industry with: Bank of Nova Scotia, Toronto-Dominion Bank, CIBC, Bank of Montreal, and National Bank.

All the banks offer a good entry dividend yield with rates ranging between Toronto-Dominion Bank’s 3.67% to CIBC’s 4.91%. With the exception of CIBC and Bank of Montreal, the banks show a similar trend in their dividend growth rates. The 10 year rates are good, but due to the global financial crisis the 3 and 5 year rates are low, and the 1 year rate shows an improvement. CIBC and Bank of Montreal haven’t shown the recent improvement in dividend growth rates that the others have. The dividend growth rates shown in the table are based on the dividends recorded in each calendar year from 2003 to 2012.
They all offer reasonable payout ratios with rates ranging from National Bank’s 40.00% to Bank of Montreal’s 49.50%. Looking at the various payout ratio history’s of all the banks and reading their annual reports it looks like the standard payout ratio target for the big six banks is 40-50% with the exception being National Bank. Based on past payout ratios National Bank looks like it is targeting a payout ratio of 30-40%. Using these payout ratio targets, the current EPS and the analyst’s 5 year annual EPS growth estimates I calculated an annual dividend growth estimate for each of the banks.
CIBC recently increased their quarterly dividend from $0.90 to $0.94 with the dividend recorded in September 2012 and then again from $0.94 to $0.96 with the dividend recorded in June 2013. The annual increase from $0.90 to $0.96 is 6.7%. This would suggest that dividend growth will be at the higher end of my estimate of 3.0-7.7%, but still below the 8% I typically like to see. CIBC has stated that their target payout ratio is 40-50% so I feel like my estimate should be fairly close.
In the past year National Bank increased its quarterly dividend from $0.79 to $0.83 and then again to $0.87. This is a 10.1% annual increase. I expect annual dividend growth at the higher end of my estimated range of 5.6-11.9%. National Bank has the lowest payout ratio of all the banks which also suggests that it has the best ability to grow its dividend. That said National Bank typically likes to keep its payout ratio lower than the other 5 banks. There are a number of good dividend growth candidates among the Canadian banks, but overall I like National Bank’s dividend growth prospects the best.
Bank of Nova Scotia has increased its dividend for 2 consecutive years, which doesn’t sound very impressive until you look at the bigger picture. It has increased its dividend in 42 of the last 45 years. This is very impressive. The most recent dividend increase happened with the dividend recorded in April 2013 when management increased the quarterly dividend by 5.3% from $0.57 to $0.60. Recently, management has been increasing the dividend twice a year, so the most recent annual dividend increase would be from $0.55 to $0.60, which is a 9.1% increase. The company’s most recent annual dividend increase of 9.1% leads me to think that future dividend growth will be around 8-10%.
Like most of the big six banks Toronto-Dominion Bank has increased its dividend twice in the past year. This led to an annual dividend increase of 12.5%. My guess is that future dividend growth will be at the higher end of my estimated range of 6.4-11.2%.
Bank of Montreal’s target payout ratio of 40-50% is shown on their website, so I feel fairly confident in my dividend growth estimate of 4.9-9.7%. In the past year Bank of Montreal increased their quarterly dividend from $0.70 to $0.72 and then again to $0.74. This is an annual increase of 5.7%. Prior to these two increases the dividend was held steady for a number of years with the previous increase recorded with the November 2007 dividend when it was increased from $0.68 to $0.70. Bank of Montreal was the slowest of the big six banks to recover from the financial crisis and begin dividend increases again. While the dividend increases appear to have started again, it is not at the 8% or above rate I like to see. With its most recent increases it looks like the dividend increases will be in the middle of my dividend growth estimates.
From a dividend growth perspective National Bank, Bank of Nova Scotia and TD Bank show the most promise. I think Royal Bank offers appealing fundamentals too, but prefer the previous three banks just mentioned. I think CIBC and Bank of Montreal will offer lower annual dividend growth below my target of 8% or more, so for the time being I don’t think I’d invest in CIBC or Bank of Montreal.
Now that I’ve reviewed the dividend fundamentals lets take a look at valuation.
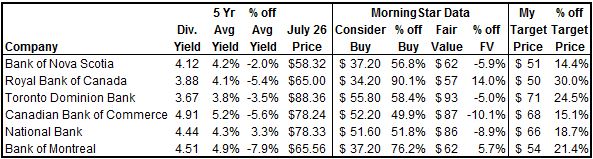
All the banks seem to be trading fairly close to their 5 year yield averages, which normally suggest a fair value. The 5 year period includes a time when bank stock prices were very low due to the global financial crisis, so the 5 year average yield could also indicate a slight undervaluation. If we look at the current price compared to Morningstar’s fair value it looks like most of the banks are undervalued by around 5-10%, with the exception of Royal Bank of Canada and Bank of Montreal which look slighlty overvalued.
None of the banks are currently below my target prices. I’d be interested in investing in Toronto-Dominion Bank, Royal Bank of Canada, Bank of Nova Scotia and National Bank should they fall below my target price. Bank of Montreal and CIBC don’t offer the dividend growth I’m looking for so I don’t plan on investing in these banks for the time being.
Conclusion
Right now Royal Bank of Canada is above my target price, but should it come down to $50 I’d consider adding to my current position. At $50 the dividend yield would be an enticing 5.0% and I expect future annual dividend growth around 8%. There are other banks that offer similarly enticing dividend fundamentals so it might just be a matter of waiting for the first one to fall below my target price. Should this happen I’d consider investing in National Bank, Bank of Nova Scotia, Toronto-Dominion Bank, or Royal Bank of Canada.
Keep your eyes out for my review of Canadian Imperial Bank of Commerce in part 5 of the Great Canadian Banking Series.
Disclaimer
I own shares of Bank of Nova Scotia and Royal Bank of Canada. You can see my portfolio here. I also own a small amount of shares of Bank of Montreal, and Canadian Imperial Bank of Canada that were left over from my DRIP selling days. I am a blogger and not a financial expert. These writings are my own opinions and should not be considered financial advice. Always perform your own due diligence before purchasing a stock. I mention target prices in this article, but this is not a recommendation to buy this stock, it is just a target price I use for my own personal investing that I have chosen to share.
Newsletter Sign-Up & Bonus
Have you enjoyed our content?
Then subscribe to our newsletter and you'll be emailed more great content from Dividend Growth Investing & Retirement (DGI&R).
BONUS: Subscribe today and you'll be emailed the most recent version of the Canadian Dividend All-Star List (CDASL).
The CDASL is an excel spreadsheet with an abundance of useful dividend screening information on Canadian companies that have increased their dividend for five or more years in a row.
The CDASL is one of the most popular resources that DGI&R offers so don't miss out!


Appreciate you sharing your efforts – info. is useful.
I was just trying to find — still looking — extent of exposure the various Cdn Banks have to residential mortgage market. I haven’t really found what i am looking for yet but did notice the annual thing price waterhouse does on cdn banks. Possibly of some interest and it dovetails with numbers you are crunching.
Here’s the link to the adobe fwiw.
http://www.pwc.com/ca/en/banking-capital-markets/publications/pwc-canadian-banks-2013-en.pdf
Thanks again for what you are doing here on your blog.
I read an article in the G&M about a report that Fitch did on the ability of the big six banks to weather a housing downturn. Here’s the link: http://www.theglobeandmail.com/report-on-business/fitch-says-canadas-big-banks-can-withstand-housing-downturn/article13727373/
a bit dated – almost 2 months stale – but here’s a decent summary via Cdn Mortgage Trends covering Q2 returns for the big 6 banks.
http://www.canadianmortgagetrends.com/canadian_mortgage_trends/2013/05/q2-2013-bank-earnings-mortgage-morsels-.html
I am having trouble computing some of the prices in your highlighted table. For example, kindly show me how you computed the highlight PE price of 58.31
This was a great read. Ever think of doing an updated version? May be interesting due to the downturn we just experienced. Thanks