Dividend Growth Investing & Retirement is supported by its readers through donations and affiliate links. If you purchase through a link on my site, I may earn a commission. Thanks! Learn more.

In the first part of this two part series I went over six different factors that affect dividend growth. Today I’m going to use TELUS and Caterpillar as examples of how I use these different influences to estimate future dividend growth.
I like to invest in undervalued dividend growth stocks with strong competitive advantages. I have a fairly strict investing criterion that I use to select dividend growth companies. One of my many investing criterion is annual dividend growth of 8% or more. Finding past dividend growth rates is fairly easy and this can help predict future dividend growth, but there is more to it than just past rates.
⭐ Find dividend growth stocks that have survived multiple recessions and increased dividends for 5, 10, 25+ years in a row.
Companies with a public dividend policy
In some rare instances a company will make estimating dividend growth easy by announcing their dividend policy. A good example would be TELUS, which recently announced that it will target a payout ratio of 65% to 75% and annual dividend growth of 10% for the next three years. They plan on increasing the dividend twice a year with the average annual increase coming in around 10%. TELUS made a similar announcement three years ago when they announced they would be targeting 10% annual dividend growth. TELUS has been providing clear guidance on its dividend growth for a while now, but this is not a common occurrence. Most of the time it is not this easy, but you can still make an educated guess with a little extra work.
Companies without a public dividend policy
When the company has not made its dividend policy public, I use earnings estimates and past payout ratios to calculate an estimated annual dividend growth rate range. Once I have the range I look at the most recent dividend increase and past dividend growth rates to see if I think dividend growth will be at the upper or lower limits of this range. I’ll use some information from my recent dividend stock analysis of Caterpillar as an example.
Caterpillar doesn’t have a public target dividend growth rate or payout ratio. Because their dividend policy isn’t public I looked at past payout ratios to see if I could determine their target payout ratio.
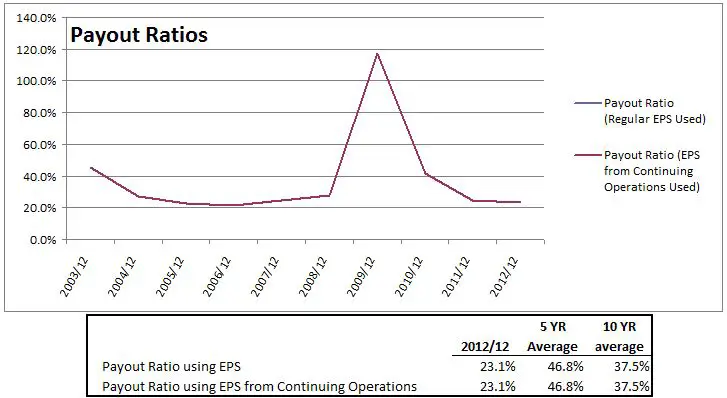
It looks like Caterpillar has been targeting a payout ratio of 20-30%, but because of the troubling times in 2009 it spiked up above 100%. Because of this spike up the 5 and 10 year payout ratio averages look inflated, so I prefer 20-30% as a reasonable range.
Now that I have a target payout ratio I can use earnings per share (EPS) and the estimated earnings growth to come up with a dividend growth range. You can get an idea of how this is done in the table below. For the specific steps see the explanations below the table.

I use Yahoo Finance’s estimated 5 year annual EPS growth. You’ll find this information near the bottom of the screen in the Analyst Estimates Section. Here is the link for Caterpillar. Right now analysts are estimating annual growth of 14.0%.
- Get the EPS and estimate EPS in 5 years
In Caterpillar’s case I used the most recent fiscal end (12-2012) EPS of $8.48. Using the 14.0% annual growth rate results in an estimated EPS in 5 years of $16.33.
- Use the payout ratio range to calculate dividends in 5 years
Use the payout ratio range of 20% to 30% and multiply it by the estimated EPS in 5 years of $16.33. This will give you estimated dividends ranging from $3.27 to $4.90.
- Compare dividends in 5 years to the current dividend to determine the dividend growth rate
In this example I used EPS for the fiscal end in December 2012, so I want to use the dividends paid out in the same period, which were $1.96. Now I can compare the dividend range of $3.27 to $4.90 to the current dividend of $1.96 to get average annual growth rates of 10.7% to 20.1%.
To calculate an average annual growth rate use the following formula:
(Dividends in 5 years/Current Divided)^(1/Number of Years)-1
To give you an example I’ll show you how I calculated the average annual dividend growth rate of 0.107487 ~ 10.7%.
(3.27/1.96)^(1/5)=0.107487
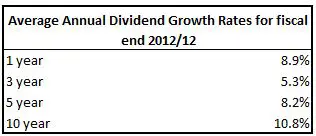
By now you should have an understanding of how I calculated Caterpillar’s annual dividend growth estimate of 10.7% to 20.1%. This is a pretty big range however, so I like to look at past dividend growth to try and come up with a better estimate. The most recent dividend increase was 15.4%, which is quite a bit higher than past averages.
Large increases are an indication from management that they expect good things in the future. Management doesn’t like to increase dividends beyond sustainable levels, because dividend cuts are viewed very negatively by shareholders. In Caterpillar’s case the recent large increase is a good signal from management that they like the future prospects of the company. With this in mind I can now guess that dividend growth will be in the middle of the 10.7% to 20.1% range, say around 15% annually.
Estimating 5 years out is difficult and analysts are thought to be right about 50% of the time so it is important to take these estimates with a grain of salt. While no one can predict the future, I still like to try and guess the dividend growth, because it forces me to see if dividend growth is sustainable. While the process may not be perfect it makes identifying good dividend growth candidates a lot easier.
Disclaimer: I own shares of TELUS. See my portfolio here.
Newsletter Sign-Up & Bonus
Have you enjoyed our content?
Then subscribe to our newsletter and you'll be emailed more great content from Dividend Growth Investing & Retirement (DGI&R).
BONUS: Subscribe today and you'll be emailed the most recent version of the Canadian Dividend All-Star List (CDASL).
The CDASL is an excel spreadsheet with an abundance of useful dividend screening information on Canadian companies that have increased their dividend for five or more years in a row.
The CDASL is one of the most popular resources that DGI&R offers so don't miss out!


Time to update CAT. Over the past three years, sales have dropped, Free Cash Flow (FCF) per share and diluted earnings per share have been declining, return on capital ditto. Although CAT kept increasing its dividend, I wonder how long this will be sustained: EPS payout ratio climbed to 83% in 2015, and the FCF payout ratio upped to 42%. Over the past three years, price of the stock under-performed SPY, and likewise total return lagged SPY, with more than twice the volatility.
Yeeks. Few bright spots here